1.Echarts饼图将数据显示在 legend旁边
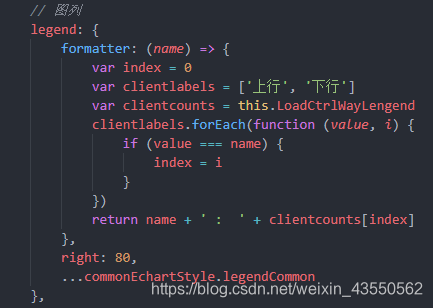
配置项代码截图:

lengend截图
完整代码:
              // 负载路数
            const loadControlWayOption = {
                // 主标题
                title: {
                    text: '负载路数统计'
                },
                // grid 直角坐标系内绘图网格
                grid: {
                    ...commonEchartStyle.grid
                },
                // 图列
                legend: {
                    formatter: (name) => {
                        var index = 0
                        var clientlabels = ['上行', '下行']
                        var clientcounts = this.LoadCtrlWayLengend
                        clientlabels.forEach(function (value, i) {
                            if (value === name) {
                                index = i
                            }
                        })
                        return name + ' :  ' + clientcounts[index]
                    },
                    right: 80,
                    ...commonEchartStyle.legendCommon
                },
                // x轴
                xAxis: {
                    data: this.loadControlXAxis,
                    ...commonEchartStyle.xAxisOption
                },
                yAxis: {
                    name: '(路)',
                    ...commonEchartStyle.yAxisOption
                },

                tooltip: {
                    // 移动鼠标显示实时数据
                    show: true,
                    trigger: 'axis'
                },
                series: [
                    {
                        ...commonEchartStyle.seriesUpOption,
                        data: this.loadControlWayUp,
                        lineStyle: {
                            width: 1
                        }
                    },
                    // 下行
                    {
                        ...commonEchartStyle.seriesDownOption,
                        data: this.loadControlWayDown,
                        lineStyle: {
                            width: 1
                        }
                    }
                ],
                color: ['#1496D0', '#00B17D']
            }
实现效果截图:

2.修改echarts上下左右距离
修改前源码及效果截图↓


修改后源码及效果截图↓

