项目中需要绘制饼图,因此简单学习了下echarts的基本使用。
head中引入js文件:
<script src="/static/frame/echarts/echarts.min.js"></script>
body中(圆饼图):
...
                    <div class="card_style layui-col-md5">
                        <div class="layui-card">
                            <div id="pie_echarts" class="layui-card-body" style=" 100%;height:170%;">
                            </div>
                        </div>
                    </div>
...
body中(横向柱状图):
...
<div class="row">
    <div id="main"></div>
</div>
...
js中:
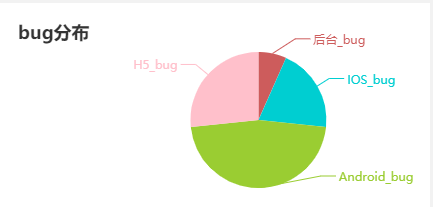
// 圆饼图
// 基于准备好的dom,初始化echarts实例
    var myChart = echarts.init(document.getElementById('pie_echarts'));
    // 指定图表的配置项和数据
    option = {
        title: {
            text: 'bug分布',
            x: 'left'
        },
        tooltip: {
            trigger: 'item',
            formatter: "{a} <br/>{b} : {c} ({d}%)"
        },
        color: ['#CD5C5C', '#00CED1', '#9ACD32', '#FFC0CB'],
        stillShowZeroSum: false,
        series: [
            {
                name: 'bug分布',
                type: 'pie',
                radius: '80%',
                center: ['60%', '60%'],
                data: [
                    {value: 1, name: '后台_bug'},
                    {value: 3, name: 'IOS_bug'},
                    {value: 7, name: 'Android_bug'},
                    {value: 4, name: 'H5_bug'},
                ],
                itemStyle: {
                    emphasis: {
                        shadowBlur: 10,
                        shadowOffsetX: 0,
                        shadowColor: 'rgba(128, 128, 128, 0.5)'
                    }
                }
            }
        ]
    };
    // 使用刚指定的配置项和数据显示图表。
    myChart.setOption(option);
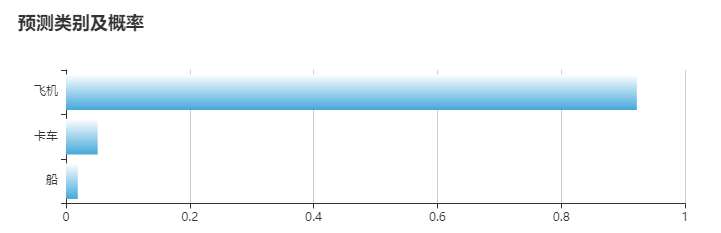
// 横向柱状图
                    var Chart = echarts.init(document.getElementById('main'));
                    Chart.setOption({
                        title: {
                            text: '预测类别及概率',

                        },
                        tooltip: {
                            trigger: 'axis',
                            axisPointer: {
                                type: 'shadow'
                            }
                        },
                        legend: {},
                        grid: {
                            left: '3%',
                            right: '4%',
                            bottom: '3%',
                            containLabel: true
                        },
                        xAxis: {
                            type: 'value',
                            boundaryGap: [0, 0.01]
                        },
                        yAxis: {
                            type: 'category',
                 // data为横坐标数据
                            data: [class_name[2], class_name[1], class_name[0]]
                        },
                        series: [{
                            type: 'bar',
                            itemStyle: {
                                normal: {

                                    color: new echarts.graphic.LinearGradient(0, 0, 0, 1, [{
                                        offset: 0,
                                        color: '#fff'
                                    }, {
                                        offset: 1,
                                        color: '#3fa7dc'
                                    }]),

                                }
                            },
                 // data为纵坐标数据
                            data: [returned_probability[2], returned_probability[1], returned_probability[0]]
                        }
                        ]
                    });