1.引入Echats
1.1script标签引入
1.2npm i 安装
2.在需要显示地图的页面,定义一个id,设置高度和宽度
<div id="homeMap" class="home-map-box"></div>
.home-map-box {
   100%;
  height: 562px;
}
3.用Echats里的方法初始化地图,下面的代码带有部分业务逻辑
3.1 this.mapChat.on('click', 'series', _this.changeMap); 点击地图区块,可以变动经纬度数据实现地图切换
3.2this.mapChat.on('georoam',()=>{}) 可控制地图的缩放和移动
      drawMap(id, update) {
        if (update) {
          this.mapChat.clear();
        } else {
          this.mapChat = echarts.init(document.getElementById(id));
        }
        const mapDate = this.circleInMap;
        const geoJson = this.mapJson;
        echarts.registerMap('zhejiang', geoJson);
        const option = {
          visualMap: {
            min: 0,
            max: 1000000,
            right: 100,
            seriesIndex: 1,
            type: 'piecewise',
            bottom: 100,
            textStyle: {
              color: '#C5F5FF'
            },
            splitList: [
              {
                lte: 10000,
                color: '#00FFFF',
                label: '数据'
              }
            ]
          },
          legend: {show: false},
          // 第二层
          geo: {
            map: 'zhejiang',
            aspectScale: 1, //长宽比
            zoom: 1.2,
            roam: 'scale',
            itemStyle: {
              normal: {
                // areaColor: '#15386C',
                areaColor: '#192652',
                shadowColor: '#13699B',
                // borderColor: '#3f9cff',
                borderColor: '#29C8FF',
                borderWidth: 0,
                //阴影的位移
                shadowOffsetX: 0,
                shadowOffsetY: 18
              },
              emphasis: {
                areaColor: '#15386C',
                borderWidth: 1.5,
                color: '#91E5FF',
                label: {
                  show: false
                }
              }
            },
            scaleLimit: {                       //所属组件的z分层,z值小的图形会被z值大的图形覆盖
              min: 0.8,                          //最小的缩放值
              max: 2.5,                            //最大的缩放值
            }
          },
          tooltip: {
            trigger: 'item',
            backgroundColor: 'rgba(16, 36, 75, 0.8)',
            padding: [8, 8, 8, 8],
            formatter: '{b}'
          },
          series: [{
            type: 'map',
            roam: 'scale',
            label: {
              normal: {
                show: true,
                textStyle: {
                  color: '#91E5FF'
                }
              },
              emphasis: {
                textStyle: {
                  color: '#91E5FF'
                }
              }
            },
            //最上面一层
            itemStyle: {
              normal: {
                // shadowColor: '#00B6FF',
                // borderColor: 'rgba(155,230,255,0.5)',
                areaColor: '#192652',
                shadowColor: '#00B6FF',
                borderColor: '#29C8FF',
                borderWidth: 2,
                // areaColor: 'transparent',
                color: '#91E5FF'
              },
              emphasis: {
                areaColor: 'rgba(12,205,231,0.71)',
                borderWidth: 0,
                color: '#91E5FF'
              }
            },
            aspectScale: 1, //长宽比
            zoom: 1.2,
            map: 'zhejiang', //使用
            tooltip: {
              show: false
            },
            // data: this.difficultData //热力图数据   不同区域 不同的底色
            scaleLimit: {                       //所属组件的z分层,z值小的图形会被z值大的图形覆盖
              min: 0.8,                          //最小的缩放值
              max: 2.5,                            //最大的缩放值
            }
          },
            {
              type: 'effectScatter',
              coordinateSystem: 'geo',
              showEffectOn: 'render',
              rippleEffect: {
                period: 8,
                scale: 3,
                brushType: 'fill'
              },
              hoverAnimation: true,
              itemStyle: {
                normal: {
                  color: '#ffff',
                  shadowBlur: 10,
                  shadowColor: '#333',

                  // offsetX: 0,
                  // offsetY: 8
                },
              },
              data: mapDate,
              tooltip: {
                trigger: 'item',
                backgroundColor: 'rgba(16, 36, 75, 0.8)',
                padding: [8, 8, 8, 8],
                formatter: function (params) {
                  const {data} = params;
                  let result = '';
                  result += `${params.name}</br>${params.marker} 监管相对人:${data.xdglr}</br>${params.marker} 被监督:${data.bjddw}`;
                  return result;
                }
              },
              scaleLimit: {                       //所属组件的z分层,z值小的图形会被z值大的图形覆盖
                min: 0.8,                          //最小的缩放值
                max: 2.5,                            //最大的缩放值
              }
            }
          ]
        };
        this.mapChat.setOption(option);
        const _this = this;
        this.mapChat.on('georoam', function (params) {
          const option = _this.mapChat.getOption(); //获得option对象
          if (params.zoom !== null && params.zoom !== undefined) { //捕捉到缩放时
            option.geo[0].zoom = option.series[0].zoom; //下层geo的缩放等级跟着上层的geo一起改变
            option.geo[0].center = option.series[0].center; //下层的geo的中心位置随着上层geo一起改变
          } else { //捕捉到拖曳时
            option.geo[0].center = option.series[0].center; //下层的geo的中心位置随着上层geo一起改变
          }
          _this.mapChat.setOption(option); //设置option
        });
        //点击事件,根据点击某个省份计算出这个省份的数据
        this.mapChat.on('click', 'series', _this.changeMap);
      },

      changeMap(params) {
        const {name} = params;
        const code = this.circleInMap.find(s => s.name === name)?.adcode;
        if (code) {
          if (JudgeAddressLevel(code.toString()) <= 2) {
            this.getMapJson(code, true)
          } else {
            Message.info('当前已到区县~')
          }
        }
      },
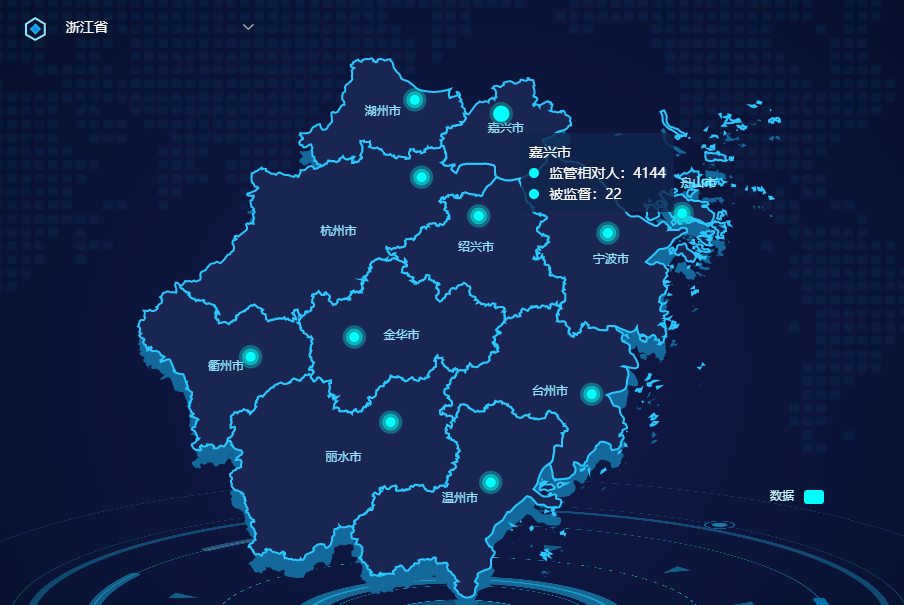
4.最后的效果图长这样

每天进步一点点~