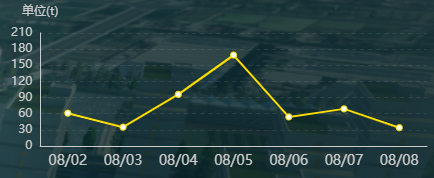
效果图:

<div style=" 462px; height: 180px" id="energyLeftTop"></div>
 // 自适应字体大小变化
    WidthAdaptive(res) {
      var windth = window.innerWidth;
      let fontSize = windth / 1920;
      return fontSize * res;
    },
    drawLine() {
      // 基于准备好的dom,初始化echarts实例
      let myChart = this.$echarts.init(
        document.getElementById("energyLeftTop")
      );

      let option = {
        backgroundColor: "transparent",
        color: ["#FFDD01"],

        grid: {
          left: "5%",
          right: "5%",
          top: "20%",
          bottom: "5%",
          containLabel: true,
        },
        xAxis: {
          axisTick: { show: false },
          axisLabel: {
            textStyle: { color: "#CCCCCC", fontSize: 14 },
          },
          axisLine: {
            // onZero: false, // X轴脱离Y轴0刻度
            lineStyle: { color: "#cccccc", type: "solid" },
          },

          data: ["08/02", "08/03", "08/04", "08/05", "08/06", "08/07", "08/08"],
        },
        yAxis: {
          name: "单位(t)",
          nameTextStyle: {
            color: "#CCCCCC",
            fontSize: this.WidthAdaptive(12),
          },
          axisTick: { show: false },
          axisLabel: {
            textStyle: { color: "#CCCCCC", fontSize: this.WidthAdaptive(12) },
          },
          axisLine: {
            lineStyle: { color: "#cccccc", type: "solid" },
          },
          splitLine: {
            lineStyle: {
              type: "dashed",
              color: "rgba(135,140,147,0.2)",
            },
          },
          boundaryGap: [0, 0.1],
        },
        series: [
          {
            name: "地面",
            type: "line",
            symbolSize: this.WidthAdaptive(6),
            data: [61, 35, 96, 169, 54, 69, 34],
          },
        ],
      };
      window.onresize = function () {
        myChart.resize();
      };
      myChart.setOption(option);
    },