Prometheus(普罗米修斯)
新型完整的监控告警工具
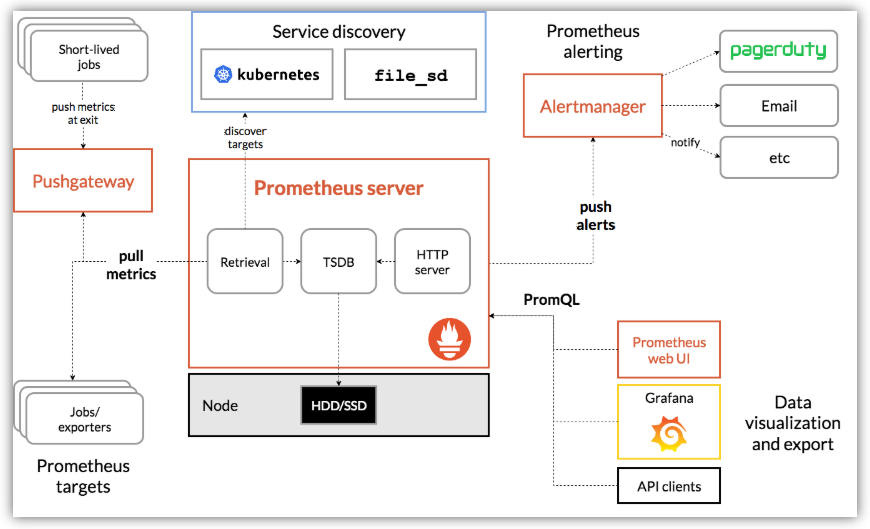
主要特点:
- 多维数据模型,时间序列数据由度量名称和键/值对标识
- 一种灵活的查询语言来利用这种维度
- 不依赖分布式存储;单个服务器节点是自治的
- 时间序列收集通过HTTP上的拉模型进行
- 通过中间网关支持时间序列的推送
- 通过服务发现或静态配置发现目标
- 多种模式的绘图和仪表板的支持
机器IP: 118.190.107.96 (阿里云)
1、安装
# 下载地址
https://prometheus.io/download/#prometheus

# centos下载linux压缩包即可。
# 上传到服务器 解压
tar xf prometheus-2.17.1.linux-amd64.tar.gz

# mv文件夹名称
cd prometheus-2.17.1.linux-amd64
mv prometheus-2.17.1.linux-amd64 prometheus

# 更改配置ip
vim prometheus.yml

# 将 localhost 改成自己的ip地址 如下图
    static_configs:
    - targets: ['118.190.217.164:9090']
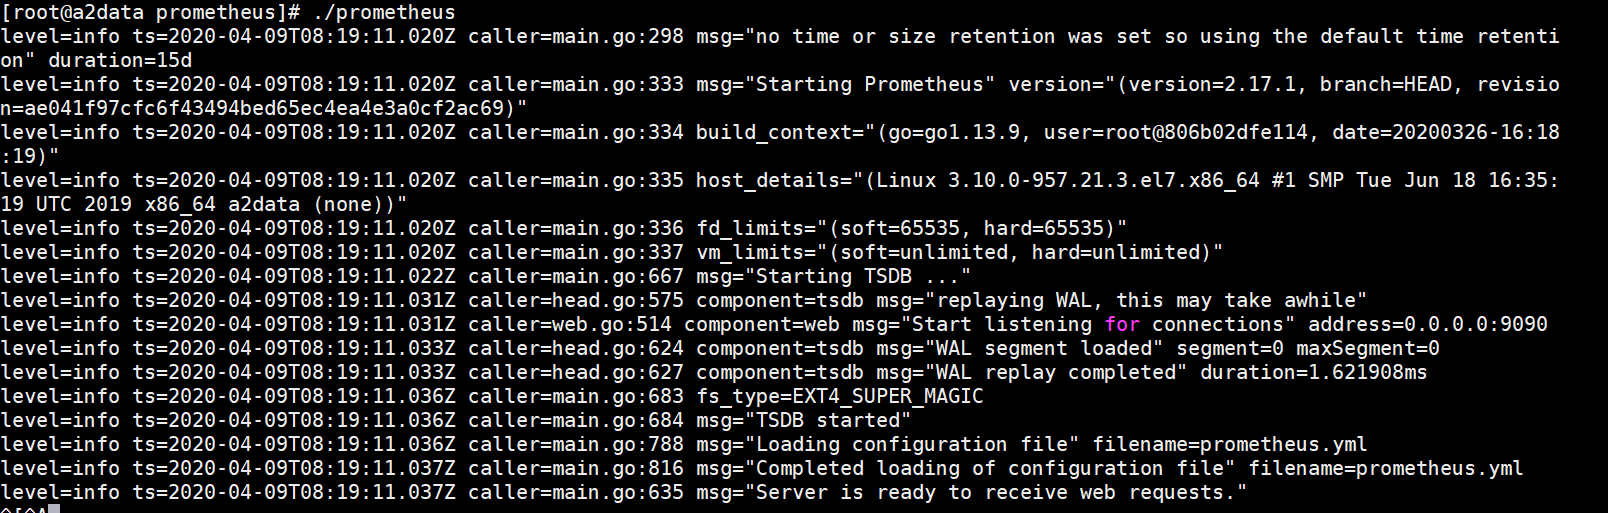
2、启动
./prometheus
3、web ui
登录访问:
118.190.217.164:9090
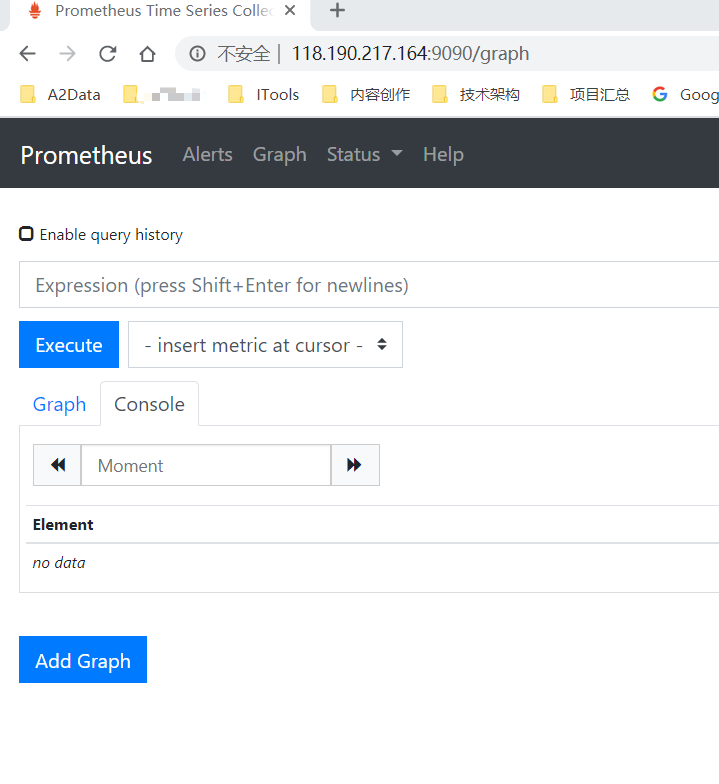
Prometheus自带有简单的UI
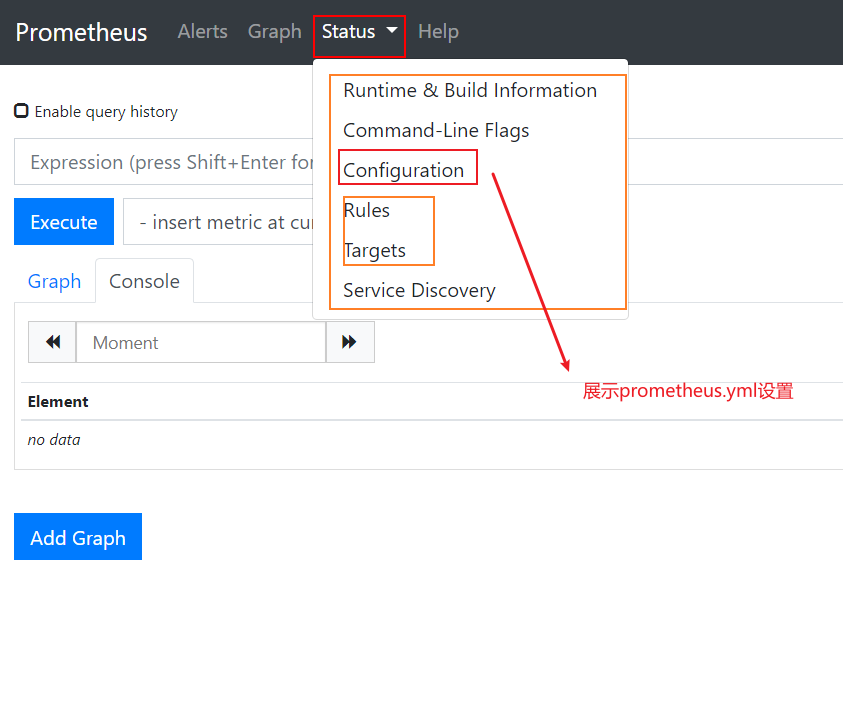
prometheus.yml的配置

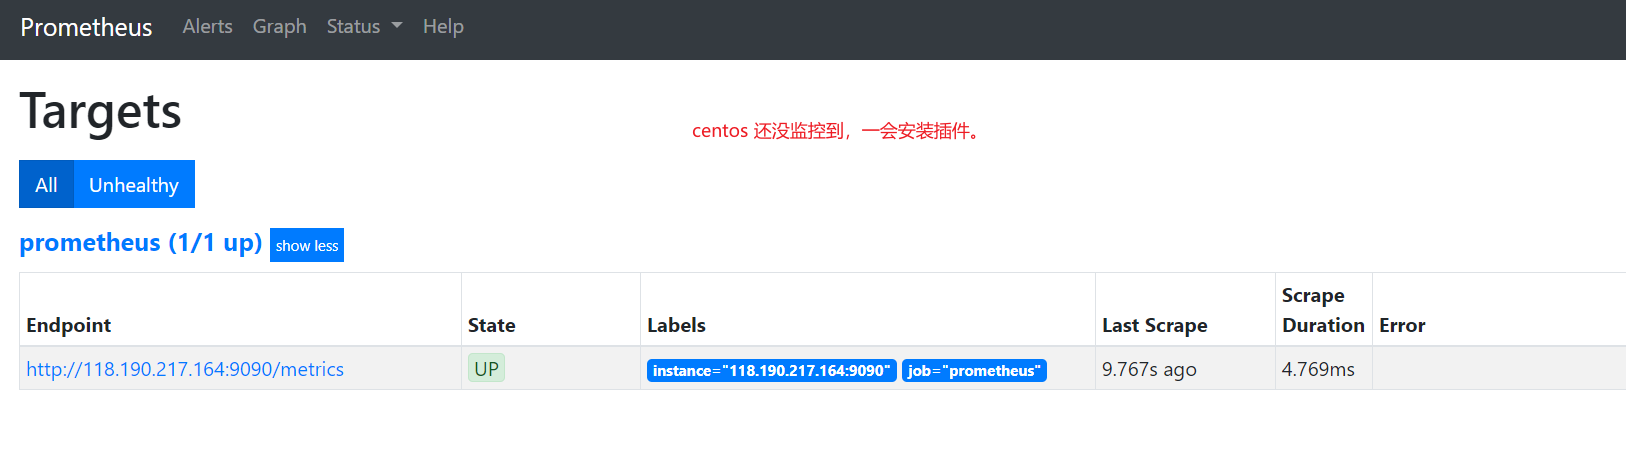
Targets展示监控具体的监控目标
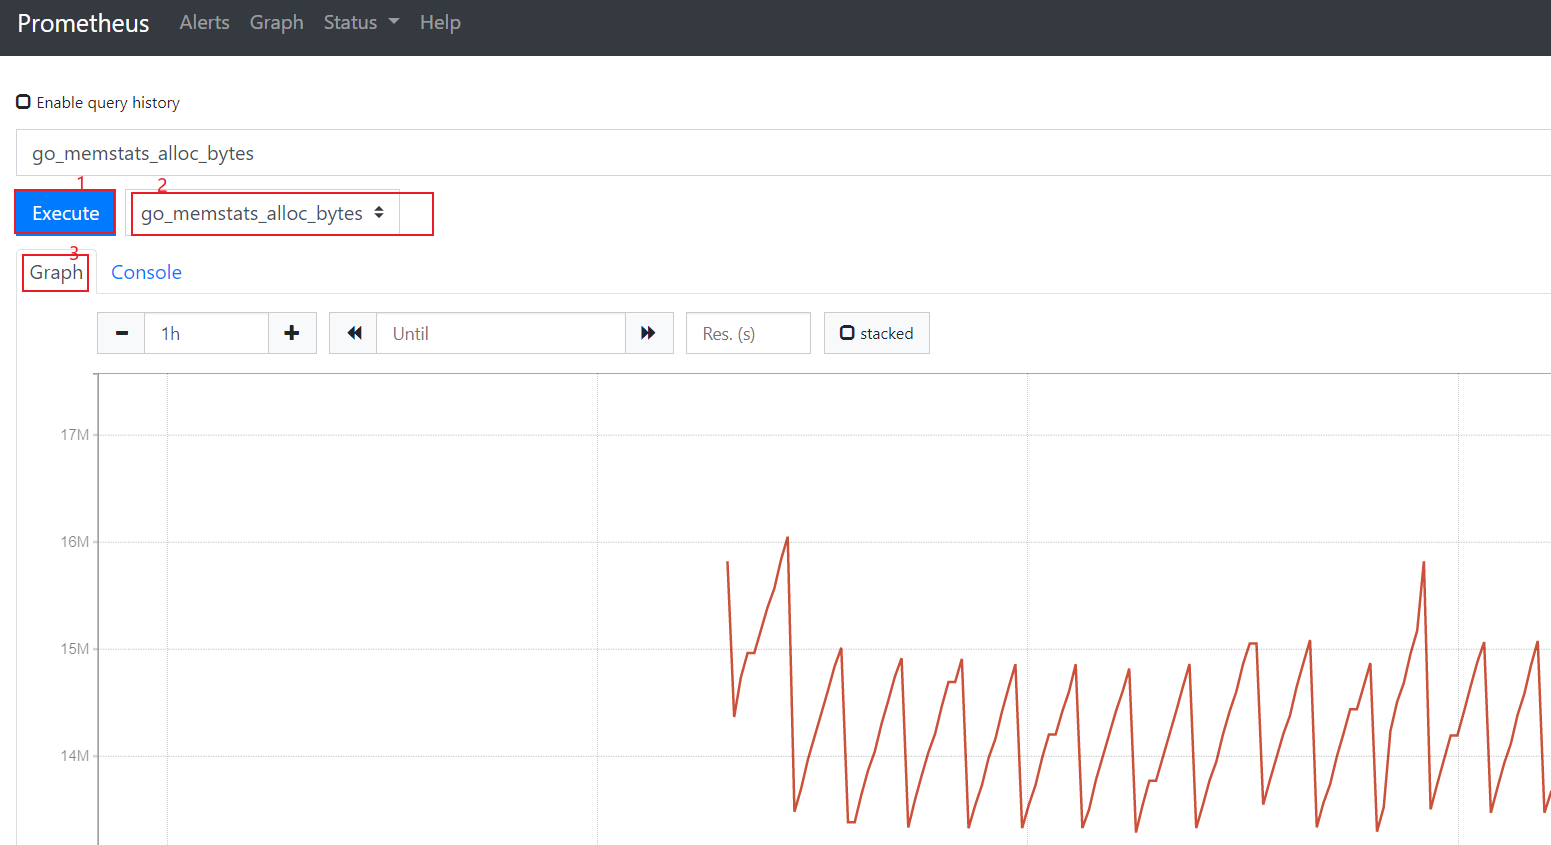
4、绘图
访问http://118.190.217.164:9090/metrics查看从exporter具体能抓到的数据,如下图所示
5、安装Grafana
普罗米修斯默认的页面可能没有那么直观,我们可以安装grafana使监控看起来更直观
wget https://dl.grafana.com/oss/release/grafana-6.1.3-1.x86_64.rpm
# 由于网速比较慢小编从csdn下载的版本
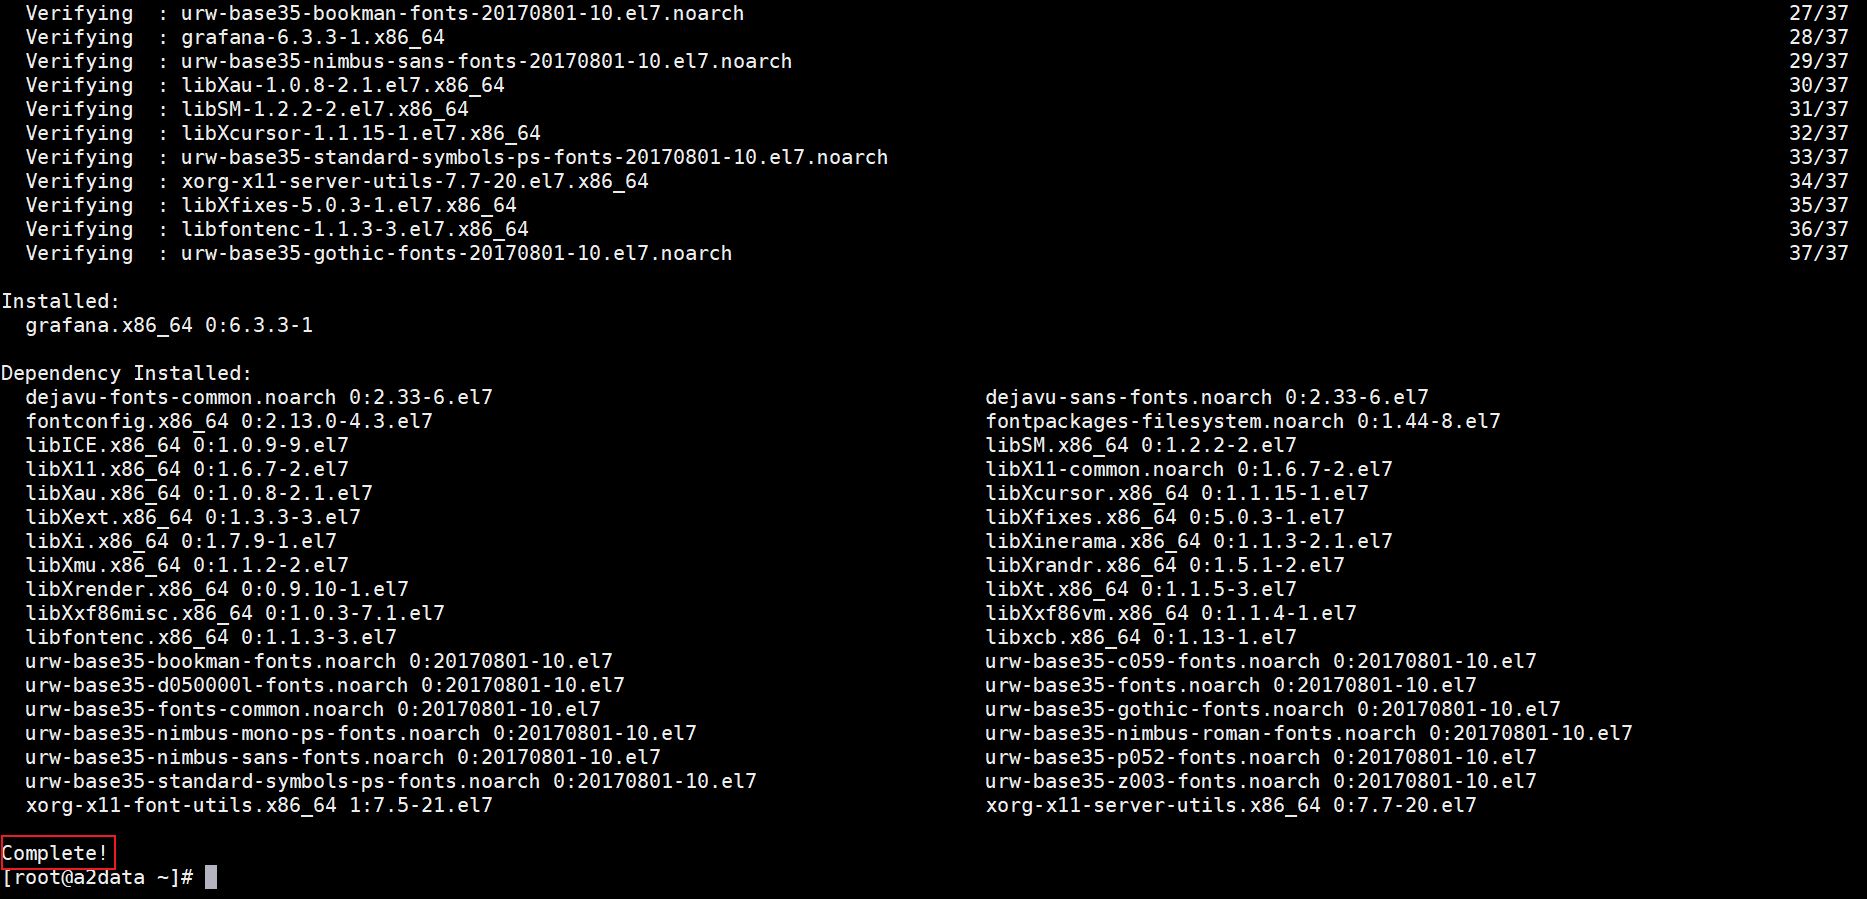
# 实用 yum安装
yum -y localinstall grafana-6.3.3-1.x86_64.rpm
Grafana的配置文件:
- 配置文件位于
/etc/grafana/grafana.ini,- 这里暂时保持默认配置即可
设置开机启动
systemctl enable grafana-server
systemctl start grafana-server

添加数据
默认登录后,要求改密码,可以选择先跳过

添加数据源
- 1、 点击 “Add data source”
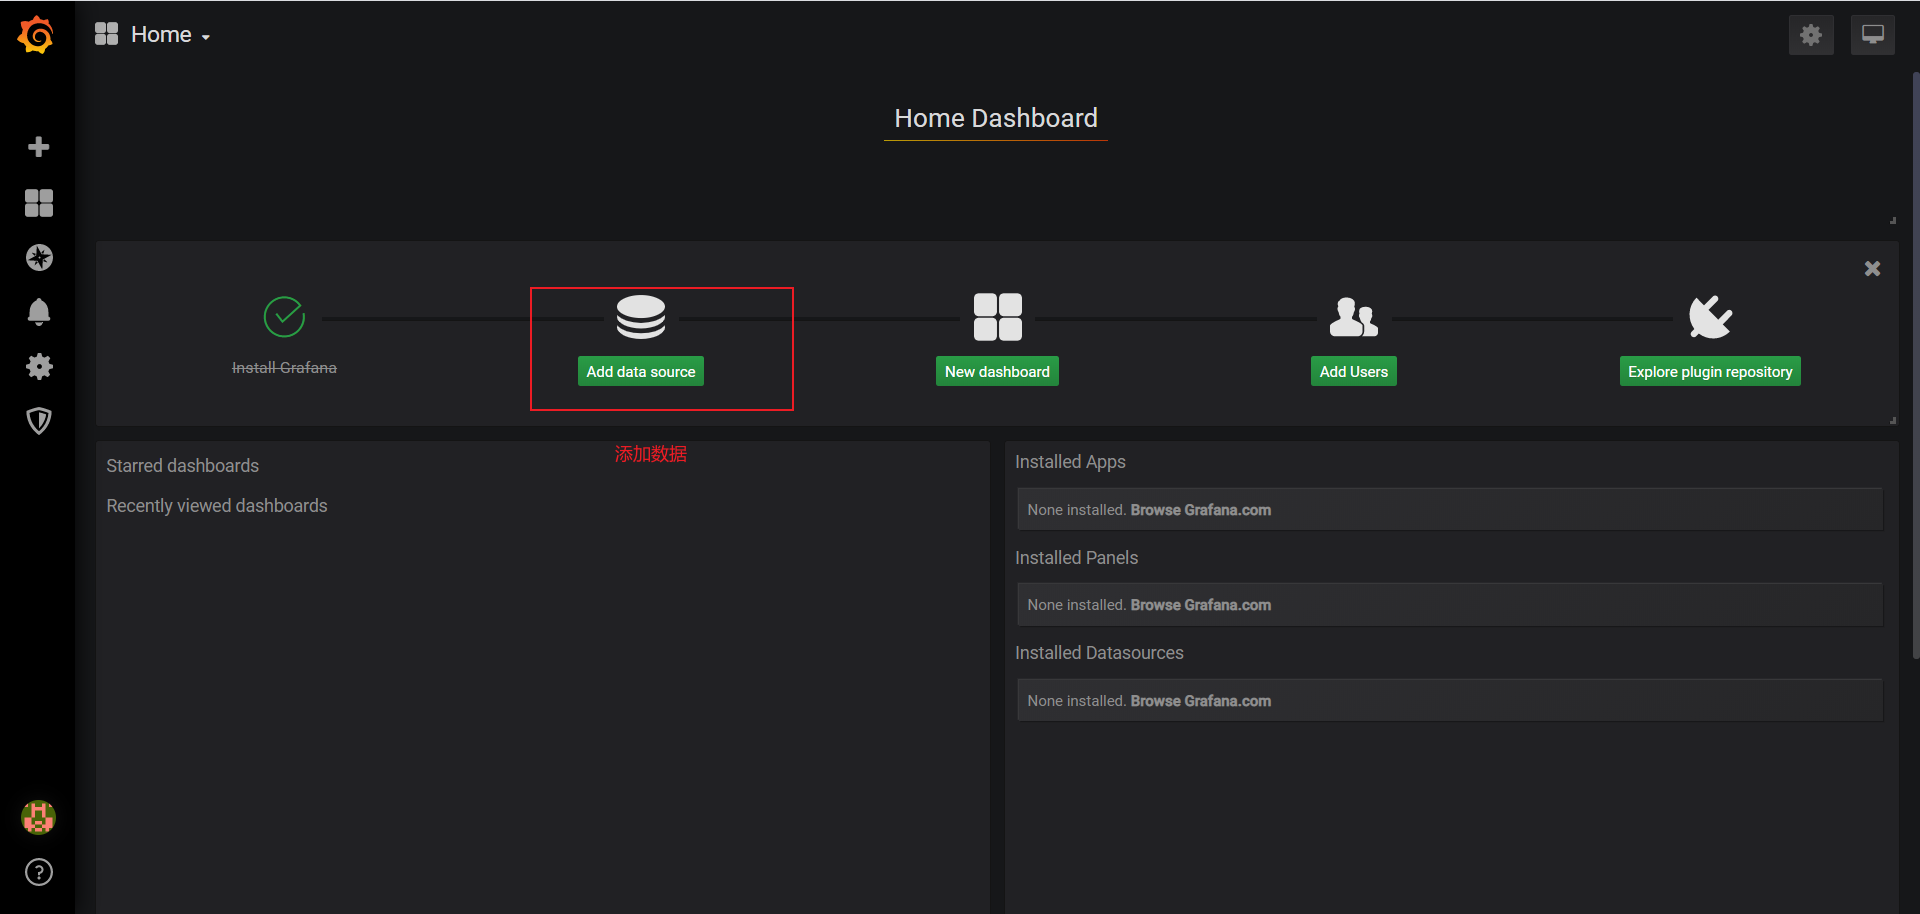
- 2、选择Prometheus
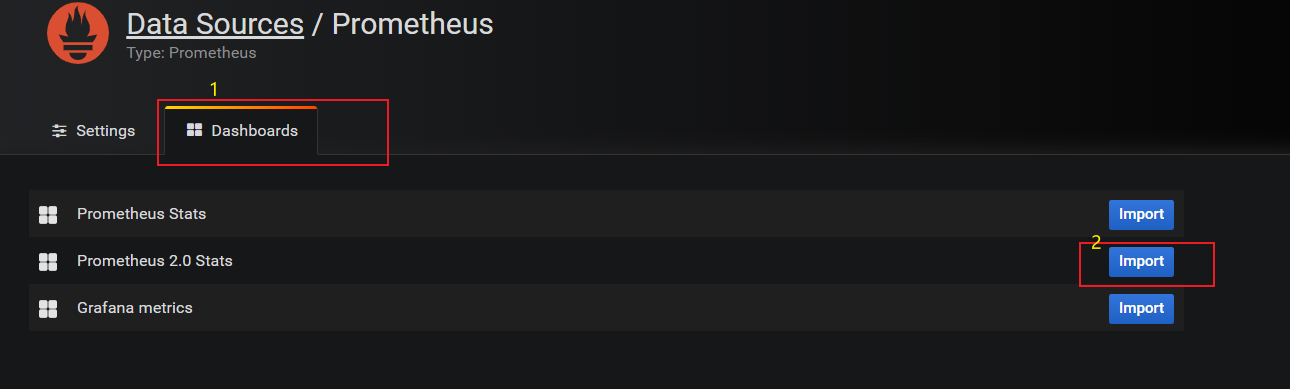
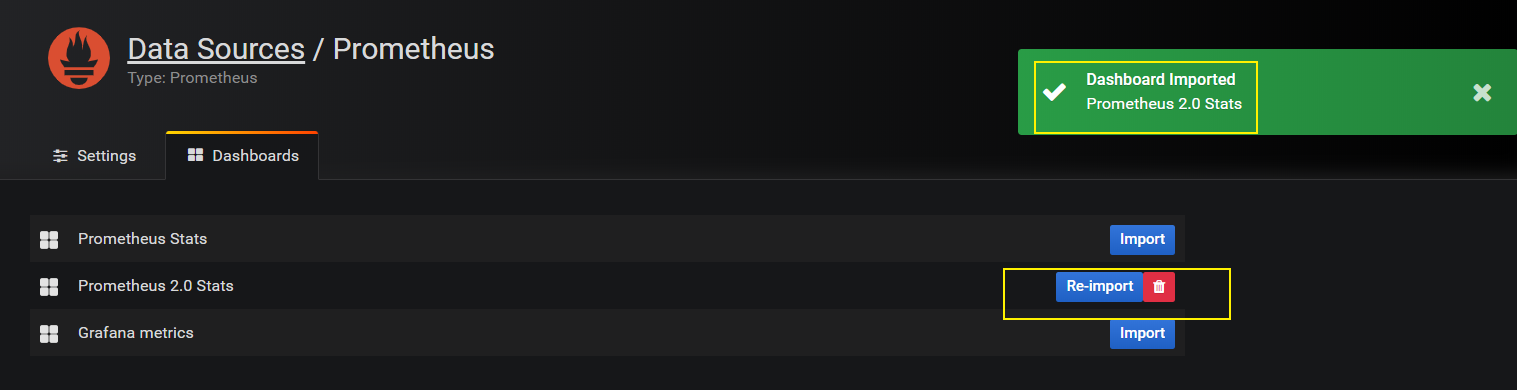
- 3、设置Prometheus地址
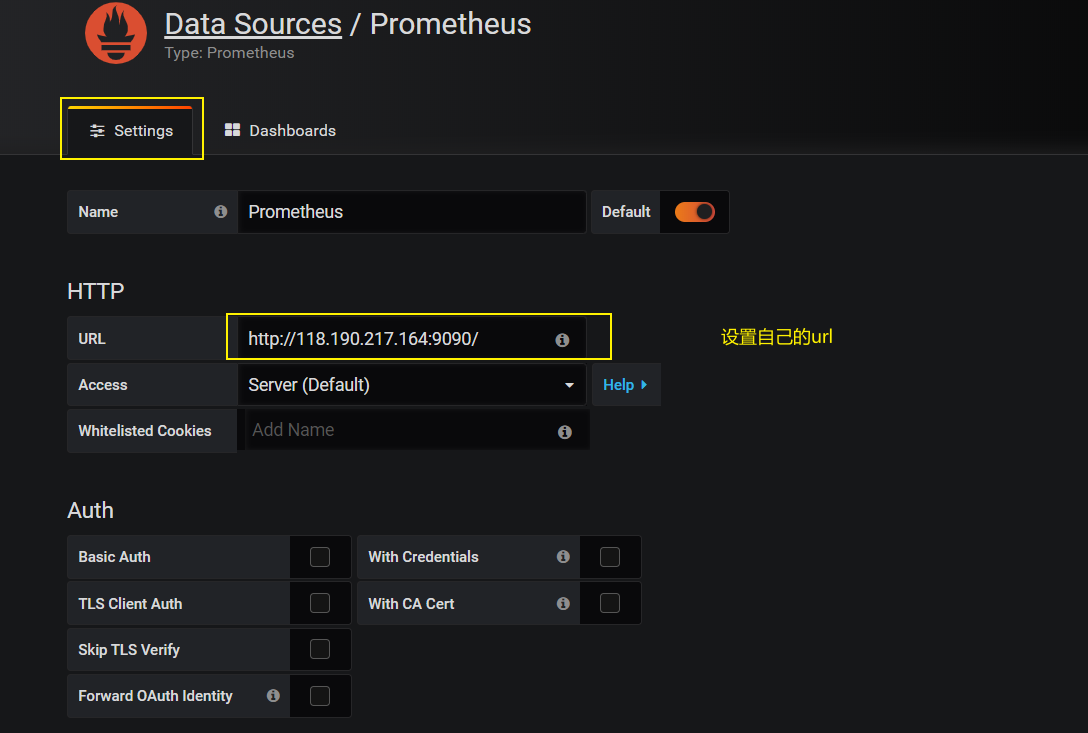
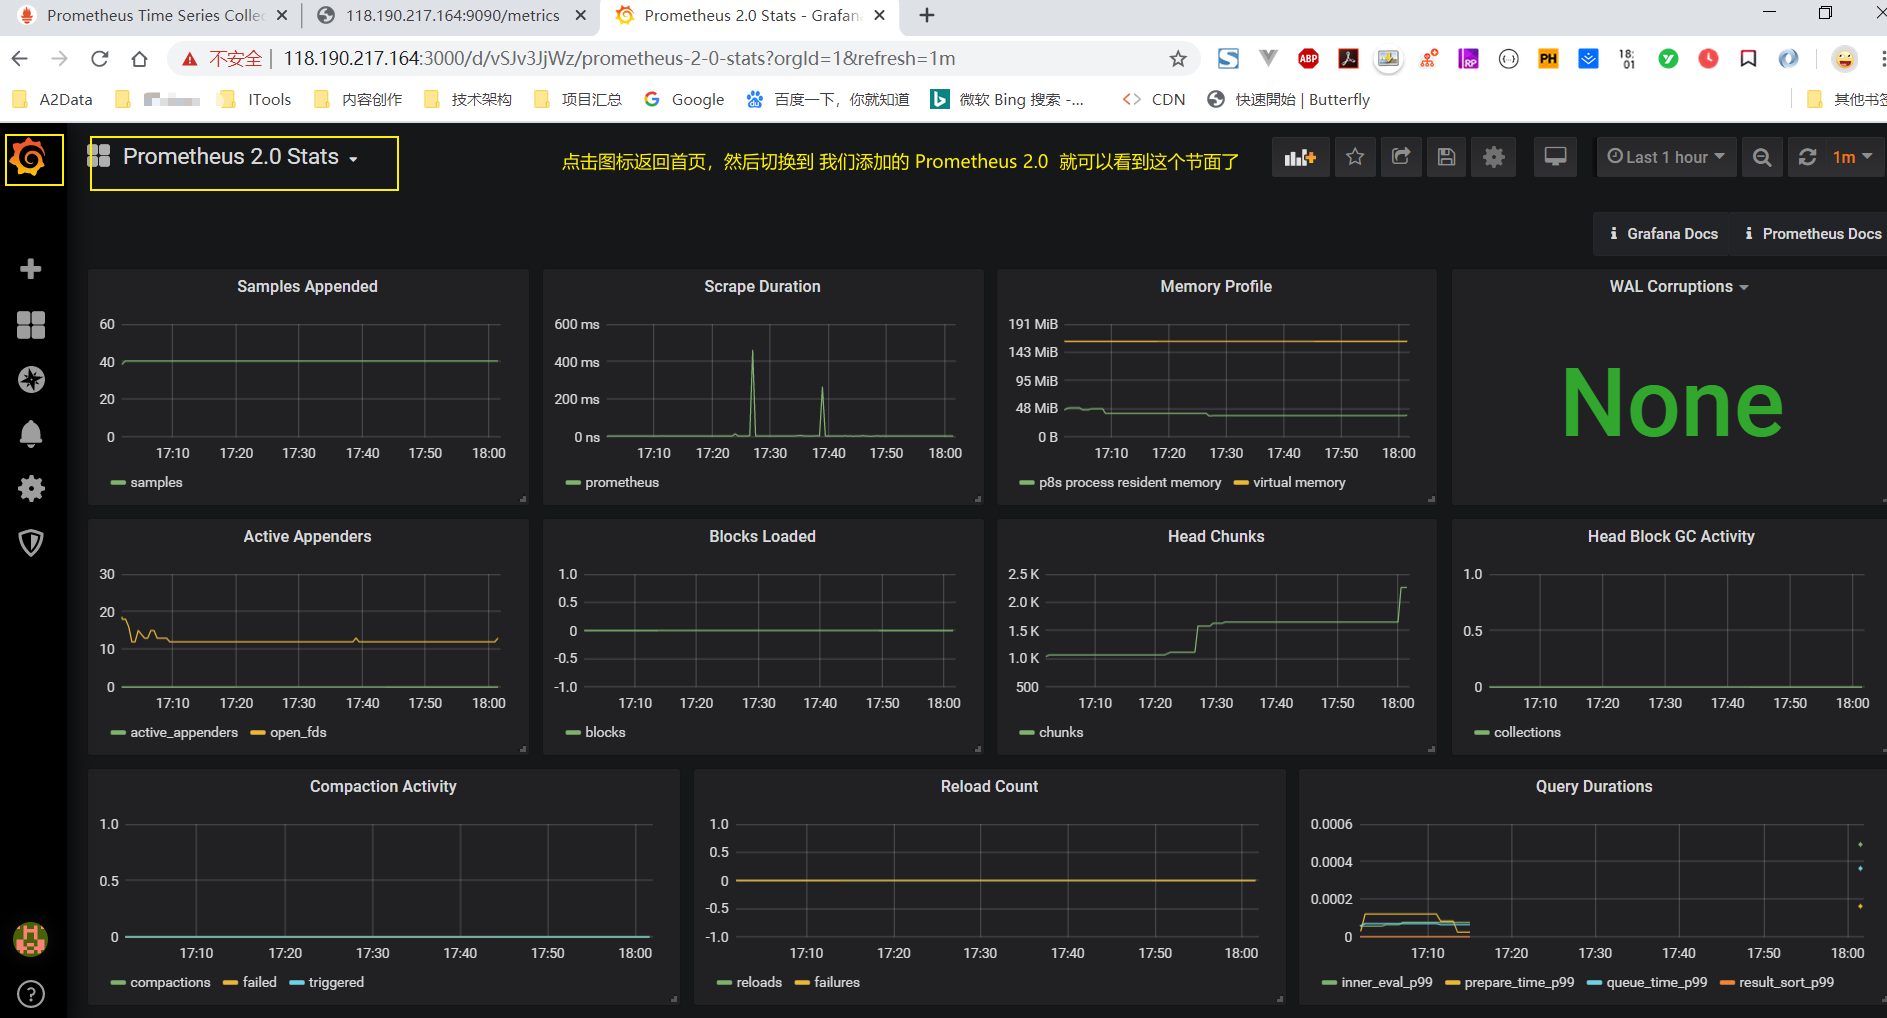
- 4、查看监控页面
拓展网站
- grafana dashboard:https://grafana.com/dashboards
- grafana plugins:https://grafana.com/plugins
系统组件
- Prometheus
- Alertmanager
- *_exproter(多个)
Prometheus
prometheus是最主要的组件,
负责采集数据,发出告警。
命名规则
metric类型
类型:
Counter ----- 累计数值,只能增加或者在重启时被归零。
Gauge ----- 瞬时值。
Histogram ---(直方图)对采集的指标进行分组计数,会生成多个指标,分别带有后缀
_bucket(仅histogram)、_sum、_count,其中_bucket是区间内计数。Summary ----也会产生多个指标,分别带有后缀
_bucket(仅histogram)、_sum、_count,可以直接查询分位数:注意:调用prometheus的sdk创建metrics的时候,必须要明确是哪一种类型的metrics
说明:Histogram和Summary都可以获取分位数。
分位数本身是用来切分数据的,它们的平均数没有同样的分位效果。
Job和Instance
被监控的具体目标是instance,监控这些instances的任务叫做job
每个job负责一类任务,可以为一个job配置多个instance,job对自己的instance执行相同的动作。
隶属于job的instance可以直接在配置文件中写死。也可以让job自动从consul、kuberntes中动态获取,这个过程就是下文说的服务发现。
配置文件
# my global config

# 全局配置
global:
  scrape_interval:     15s # Set the scrape interval to every 15 seconds. Default is every 1 minute.
  evaluation_interval: 15s # Evaluate rules every 15 seconds. The default is every 1 minute.
  # scrape_timeout is set to the global default (10s).

# Alertmanager configuration
alerting:
  alertmanagers:
  - static_configs:
    - targets:
      # - alertmanager:9093

# Load rules once and periodically evaluate them according to the global 'evaluation_interval'.
rule_files:
  # - "first_rules.yml"
  # - "second_rules.yml"

# A scrape configuration containing exactly one endpoint to scrape:
# Here it's Prometheus itself.

# 指定要监控的目标 ,每一个监控目标是一个job
scrape_configs:
  # The job name is added as a label `job=<job_name>` to any timeseries scraped from this config.
  - job_name: 'prometheus'

    # metrics_path defaults to '/metrics'
    # scheme defaults to 'http'.

    static_configs:
    - targets: ['118.190.217.164:9090']
relabel_config
---扩展采集能力
__address__         : 检测目标的地址
__scheme__          : http、https等
__metrics_path__    : 获取指标的路径

-----------------------------------

- job_name: "user_server_icmp_detect"
  consul_sd_configs:
  - server: "118.190.217.164:8500"
  scheme: http
  metrics_path: /probe
  params:
    module: [icmp]
  relabel_configs:
  - action: keep
    source_labels: [__meta_consul_tags]        #如果__meta_consul_tags匹配正则,则保留该目标
    regex: '.*,icmp,.*'
  - source_labels: [__meta_consul_service]
    regex: '(.+)@(.+)@(.+)'
    replacement: ${2}
    target_label: type
  - source_labels: [__meta_consul_service]
    regex: '(.+)@(.+)@(.+)'
    replacement: ${1}
    target_label: user
  - source_labels: [__address__]
    regex: (.+):(.+)
    replacement: ${1}
    target_label: __param_target
  - target_label: __address__
    replacement:  10.10.199.154:9115
  - source_labels: [__param_target]
    target_label: instance
查询语句
查询语句直接就是指标的名称:
go_memstats_other_sys_bytes但是可以通过标签筛选:
go_memstats_other_sys_bytes{instance="118.190.217.164"}标签属性可以使用4个操作符:
=: Select labels that are exactly equal to the provided string.
!=: Select labels that are not equal to the provided string.
=~: Select labels that regex-match the provided string (or substring).
!~: Select labels that do not regex-match the provided string (or substring).
并且可以使用多个标签属性,用“,”间隔,彼此直接是与的关系,下面是prometheus文档中的一个例子:
http_requests_total{environment=~"staging|testing|development",method!="GET"}甚至只有标签:
{instance="118.190.217.164"}对查询出来的结果进行运算也是可以的:
# 时间范围截取,Range Vector Selectors
http_requests_total{job="prometheus"}[5m]

# 时间偏移
http_requests_total offset 5m

# 时间段内数值累加
sum(http_requests_total{method="GET"} offset 5m)
告警规则配置
alert rules在单独的文件中定义,然后在prometheus.yml中引用:
rule_files:
  - "first_rules.yml"
  # - "second_rules.yml"
rules文件格式如下:
$ cat first_rules.yml
groups:
- name: rule1-http_requst_total
  rules:
  - alert:  HTTP_REQUEST_TOTAL
    expr: http_requests_total > 100
    for: 1m
    labels:
      severity: page
    annotations:
      summary: Http request total reach limit
需要注意,还要在prometheus.yml中配置alertmanager的地址:
# Alertmanager configuration
alerting:
  alertmanagers:
  - static_configs:
    - targets:
      - 118.190.217.164:9093
重新加载配置文件后,可以在prometheus的rule页面看到告警规则,在alert页面看到触发的告警,
现在alertmanager还没有部署,在下一节部署了alertmanager之后,告警可以在alertmanager中看到。
Alertmanager
用来接收prometheus发出的告警,然后按照配置文件的要求,将告警用对应的方式发送出去。
部署启动
wget https://github.com/prometheus/alertmanager/releases/download/v0.15.2/alertmanager-0.15.2.linux-amd64.tar.gz

tar -xvf alertmanager-0.15.2.linux-amd64.tar.gz


解压得到:
alertmanager  alertmanager.yml  amtool  LICENSE  NOTICE


启动:
./alertmanager

打开服务:
http://IP地址:9093/#/alerts
配置文件
global:
  resolve_timeout: 5m

route:
  group_by: ['alertname']
  group_wait: 10s
  group_interval: 10s
  repeat_interval: 1h
  receiver: 'web.hook'
receivers:
- name: 'web.hook'
  webhook_configs:
  - url: 'http://118.190.217.164:5001/'
inhibit_rules:
  - source_match:
      severity: 'critical'
    target_match:
      severity: 'warning'
    equal: ['alertname', 'dev', 'instance']
告警方式
email_config
hipchat_config
pagerduty_config
pushover_config
slack_config
opsgenie_config
victorops_config
webhook_config   ---- 将邮件发送到这个url
wechat_config
邮件通知
这里给出一个用邮件通知告警的例子,发件邮箱用的是网易邮箱:
global:
  resolve_timeout: 5m
route:
  group_by: ['alertname']
  group_wait: 10s
  group_interval: 10s
  repeat_interval: 1h
  receiver: 'mail'
receivers:
- name: 'web.hook'
  webhook_configs:
  - url: 'http://118.190.217.164:5001/'
- name: 'mail'
  email_configs:
  - to: 接收告警用的邮箱
    from: 你的发件用的网易邮箱
    smarthost:  smtp.163.com:25
    auth_username: 网易邮箱账号
    auth_password: 网易邮箱密码
    # auth_secret:
    # auth_identity:
inhibit_rules:
  - source_match:
      severity: 'critical'
    target_match:
      severity: 'warning'
    equal: ['alertname', 'dev', 'instance']
注意这里有web.hook和mail两个reciver,使用哪个receive是在上面的router中配置的:
route:
  group_by: ['alertname']
  group_wait: 10s
  group_interval: 10s
  repeat_interval: 1h
  receiver: 'mail'
重新加载配置后,就可以收到告警邮件了。
集群模式
什么是集群模式?
即多个alaertmanager一起运行,彼此之间通过gossip协议获知告警的处理状态,防止告警重复发出。
如何配置:
- 使用gossip协议
- 启动时指定一个或者多个 alertmanager的地址
--cluster.peer=118.190.217.164:9094
*__exporter
exporter 是一组程序,作用:
- 采集物理机
- 中间件的信息
- rometheus官方 支持
- 也有第三方支持的
系统指标
Databases
    Aerospike exporter
    ClickHouse exporter
    Consul exporter (official)
    CouchDB exporter
    ElasticSearch exporter
    EventStore exporter
...
Hardware related
    apcupsd exporter
    Collins exporter
    IoT Edison exporter
...
Messaging systems
    Beanstalkd exporter
    Gearman exporter
    Kafka exporter
...
Storage

    Ceph exporter
    Ceph RADOSGW exporter
...
HTTP

    Apache exporter
    HAProxy exporter (official)
...
APIs
    AWS ECS exporter
    AWS Health exporter
    AWS SQS exporter
Logging

    Fluentd exporter
    Google's mtail log data extractor
...
Other monitoring systems
    Akamai Cloudmonitor exporter
    AWS CloudWatch exporter (official)
    Cloud Foundry Firehose exporter
    Collectd exporter (official)
...
Miscellaneous

    ACT Fibernet Exporter
    Bamboo exporter
    BIG-IP exporter
...
blackbox_exporter
主要作用于探测url、domain等联通、响应情况的exporter。
部署启动
#下载压缩包
https://github.com/prometheus/blackbox_exporter/releases/download/v0.12.0/blackbox_exporter-0.12.0.linux-amd64.tar.gz

# 解压
tar xf blackbox_exporter-0.12.0.linux-amd64.tar.gz

# 直接运行,默认监听地址是:9115
配置文件
modules:
  http_2xx:
    prober: http
    http:
  http_post_2xx:
    prober: http
    http:
      method: POST
  tcp_connect:
    prober: tcp
  pop3s_banner:
    prober: tcp
    tcp:
      query_response:
      - expect: "^+OK"
      tls: true
      tls_config:
        insecure_skip_verify: false
  ssh_banner:
    prober: tcp
    tcp:
      query_response:
      - expect: "^SSH-2.0-"
  irc_banner:
    prober: tcp
    tcp:
      query_response:
      - send: "NICK prober"
      - send: "USER prober prober prober :prober"
      - expect: "PING :([^ ]+)"
        send: "PONG ${1}"
      - expect: "^:[^ ]+ 001"
  icmp:
    prober: icmp
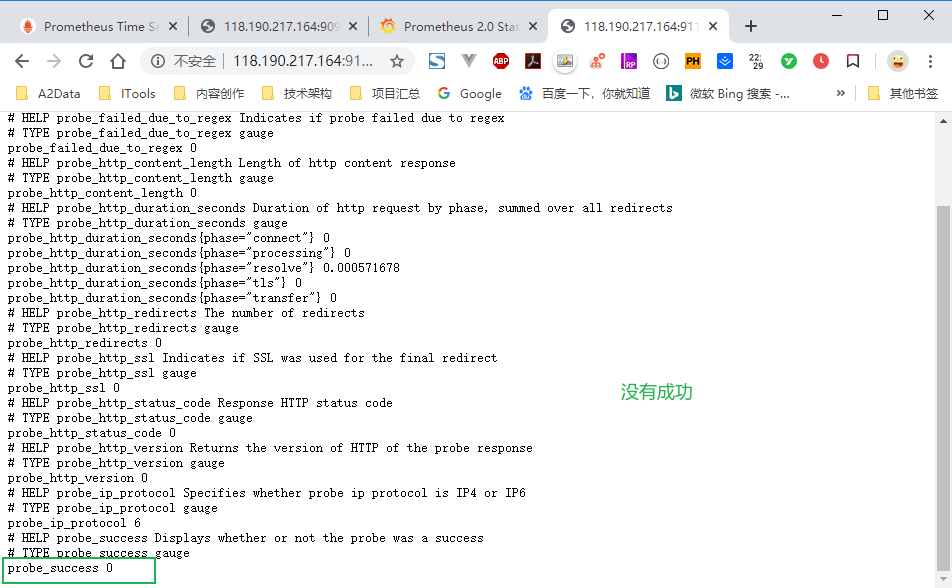
案例获取百度指标
例如要获取域名
www.baidu.com的指标,要用http_2xx模块,传入参数www.baidu.com:小编尝试 失败应该是 阿里云端口限制的问题。
http://118.190.217.164:9115/probe?module=http_2xx&target=http%3A%2F%2Fwww.baidu.com%2F
其他配置
运算[Operators: https://prometheus.io/docs/prometheus/latest/querying/operators/
# 容器CPU负载告警
# container_cpu_load_average_10s, container_spec_cpu_quota, container_spec_cpu_shares, container_spec_cpu_quota
# 容器CPU limit: container_spec_cpu_quota / container_spec_cpu_period
# 计算空间的CPU使用率:sum(rate(container_cpu_usage_seconds_total{namespace=~".+"}[1m])) by (namespace) * 100
# 计算容器CPU使用率:sum(rate(container_cpu_usage_seconds_total{name=~".+"}[1m])) by (name) * 100
# rate(container_cpu_usage_seconds_total{name=~".+"}[1m])
计算容器的内存使用率:
container_memory_usage_bytes{container_name!="", pod_name!=""} / container_spec_memory_limit_bytes{container_name!="", pod_name!=""}

container_memory_usage_bytes{instance="prod-k8s-node-155-171",container_name!="", pod_name!=""} / container_spec_memory_limit_bytes{instance="prod-k8s-node-155-171",container_name!="", pod_name!=""}

container_memory_usage_bytes{container_name!="", pod_name!=""} / container_spec_memory_limit_bytes{container_name!="", pod_name!=""} > 0.98

container_memory_rss{container_name!="", pod_name!=""}/container_spec_memory_limit_bytes{container_name!="", pod_name!=""} >0.98