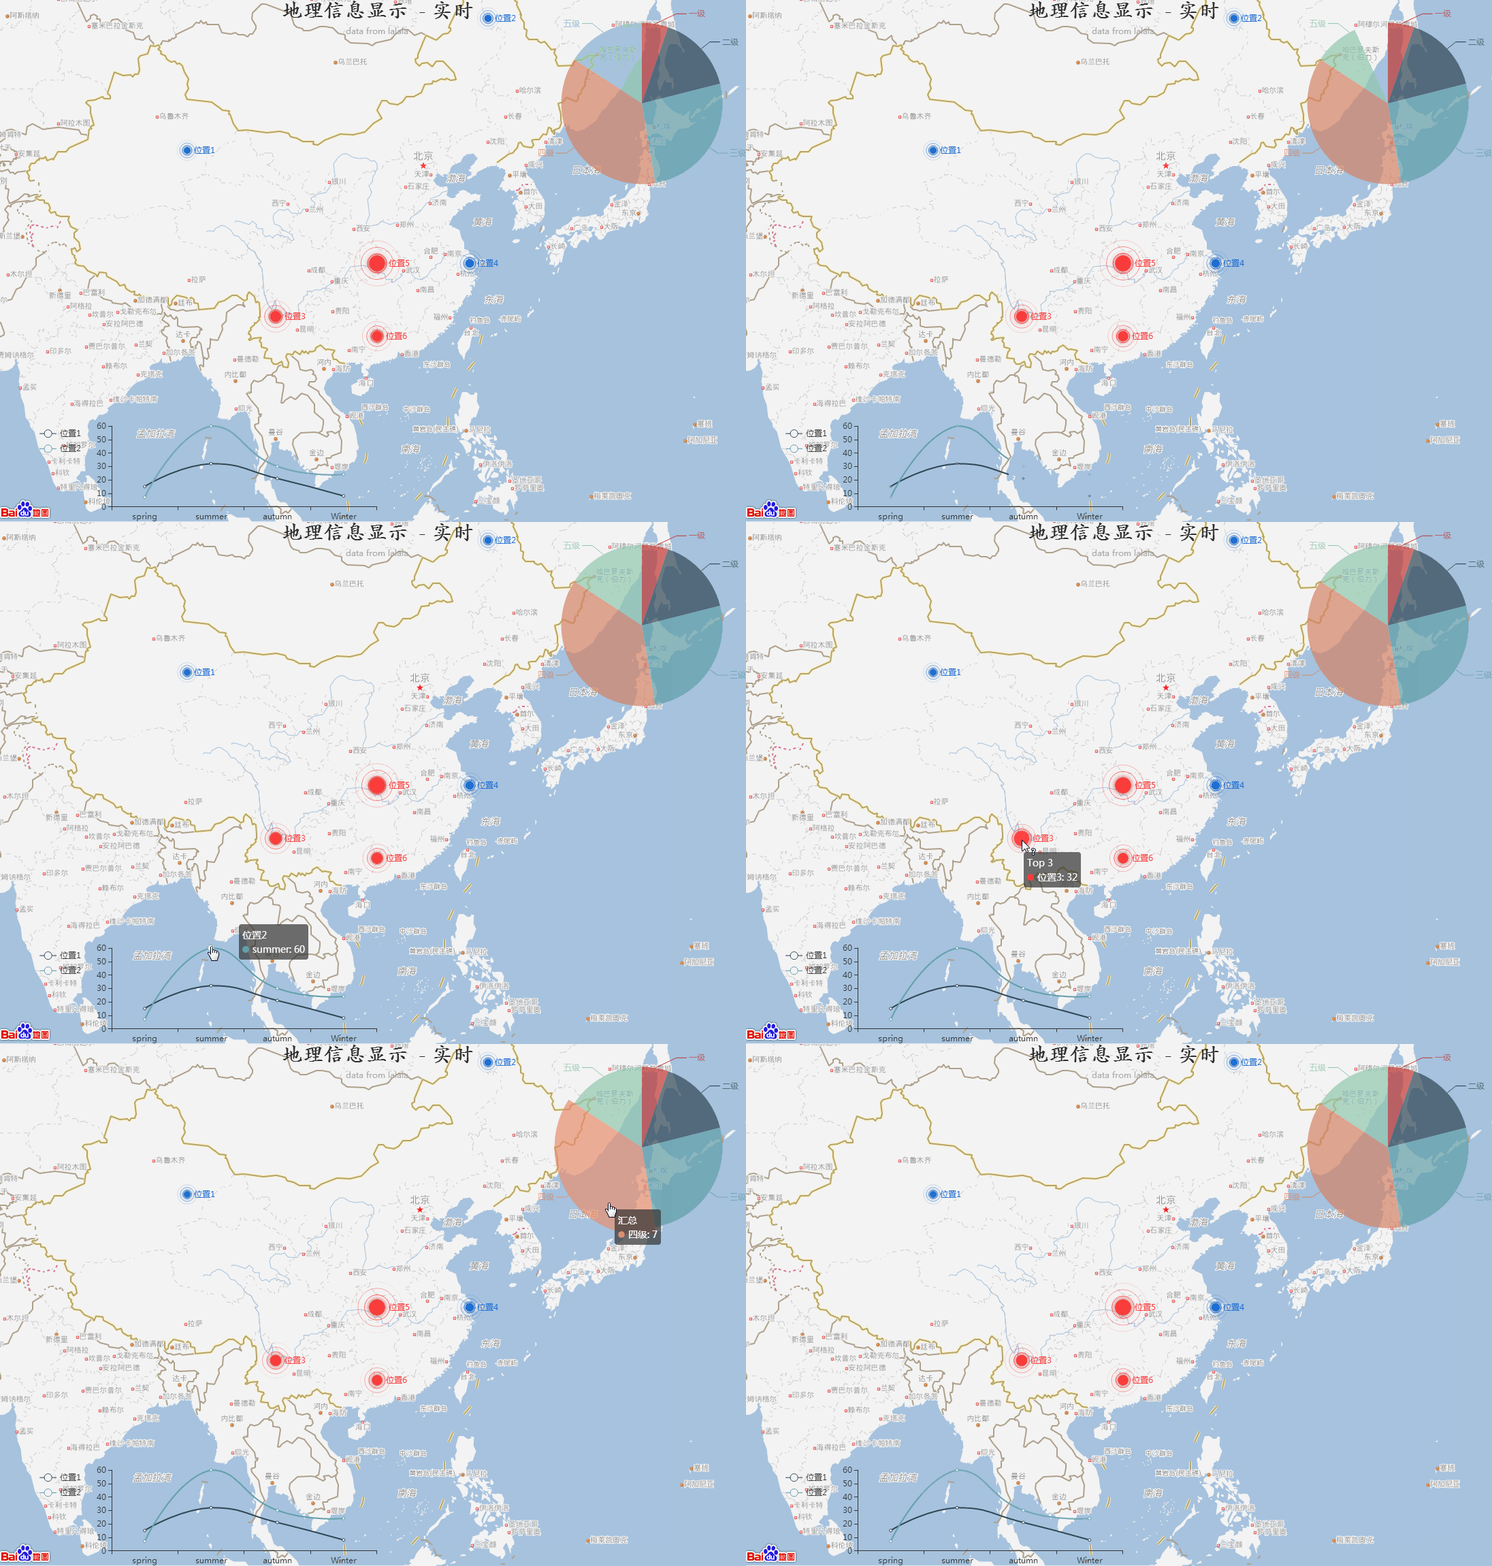
Ecahrts 基于地理信息的可视化
Echarts 是一款基于js的交互式图表工具
这一模型可用于显示气候、地理、人流等各种信息。
1、环境
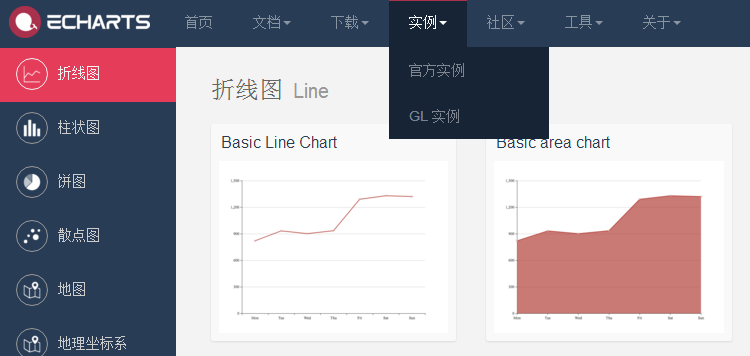
- 在线调试echarts的功能可以在官网,选择实例下任意一个点开:
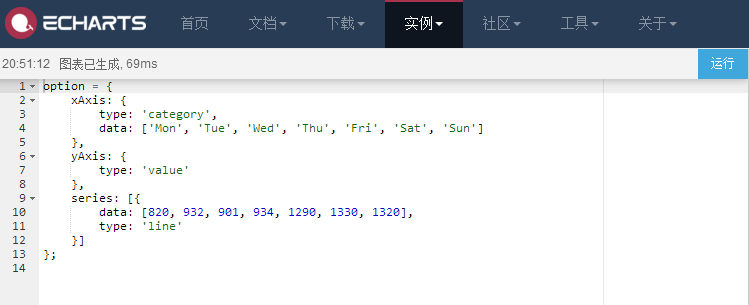
然后在左侧的编辑框中即可编辑(其中包含了自动渲染脚本,十分适合入门使用):
2、地理信息绘制
首先需要明确要显示的地理位置和对应的物理量。
//显示地理信息
//主要参考了一下demo:
//http://www.echartsjs.com/examples/editor.html?c=effectScatter-bmap
//http://www.echartsjs.com/examples/editor.html?c=map-parallel-prices
//http://www.echartsjs.com/examples/editor.html?c=line-simple
//http://www.echartsjs.com/examples/editor.html?c=pie-legend

//首先先定义需要显示对应信息的位置坐标,按照[纬度,精度]的格式
var geoCoordMap = {
    '位置1':[90.9180416971,41.0807155340],
    '位置2':[123.4965120599,51.0206466741],
    '位置3':[100.4728967514,26.1734892363],
    '位置4':[121.5121844054,31.2106872661],
    '位置5':[111.50148,31.2458353752],
    '位置6':[111.50148,24.2458353752],
    //ref:http://www.gpsspg.com/maps.htm  //这里可以得到对应地点的gps经纬度,也可批量查询
    //http://lbsyun.baidu.com/index.php?title=jspopular/guide/conflux
    //http://lbsyun.baidu.com/custom/

};
//随后定义每个位置需要显示的量的值
var data = [
     {name: '位置1', value: 19},
     {name: '位置2', value: 20},
     {name: '位置3', value: 32},
     {name: '位置4', value: 24},
     {name: '位置5', value: 46},
     {name: '位置6', value: 30},
];
随后需要对数据进行处理,将坐标信息和对应物理量的值合在一起。
var convertData = function (data) {
    var res = [];
    for (var i = 0; i < data.length; i++) {
        var geoCoord = geoCoordMap[data[i].name];    //首先根据data中的name作为键值读入地理坐标
        //var rjj1 = data[i].value;
        if (geoCoord) {
            res.push({
                name: data[i].name,
                value: geoCoord.concat(data[i].value)   //随后将地理坐标与对应信息值衔接起来
                //成为了 [name 经度 纬度 value]的形式

            });
        }
    }
    //console.log(res)
    return res;
};
接下来就是对于echarts 对象具体值的设置了,全局选项option
option = {
    title: {
        text: '地理信息显示  - 实时',    //整个图标的标题显示
        subtext: 'data from lalala',    //子标题显示
        sublink: 'http://somewhere',	//子标题超链接
        left: 'center',                 //标题位置 可以left center right
        textStyle : {
            color: '#2f2f2f',	//	定义字体颜色
            fontFamily:'STKaiti',  //定义字体
            //https://www.zhangxinxu.com/wordpress/2017/03/css-font-family-chinese-english/
            //这里可以找到各种字体对应的英文
            fontSize:'30',		//定义字体大小
        }
    },
    tooltip : {
        trigger: 'item'    //提示框
    },


    //这部分用来绘制每一个点的信息随时间的变化,叠加在地图上
    //for time serial lines
    xAxis: {
        type: 'category',
        data: ['spring', 'summer', 'autumn', 'Winter'],    //x轴的各个时序指标
    },
    yAxis: {
        type: 'value',  //y值为数值
        splitLine:{show: false},//去除网格线
    },
    legend: {
    data:['位置1','位置2'],    //所要画的位置,作为画时序线的系列
    y: 'bottom',               //legend的y位置top bottom right left
    x: 'right',               //legend的x位置
    orient: 'vertical',       //图例的排序,垂直或者水平
    top: '80%',				//距离顶端的百分比,也可以用像素来做大小
    left: '5%'              //图例距离左端的百分比
    },
    grid: {
        top: '80%',bottom:'5%', left: '15%',right: '50%',
        //坐标轴距离上下左右的百分比
        opacity: '0.1'   //透明度

    },
    Opacity: 0.2,
    //for time
    //画时序图的坐标轴定义结束

    //******************************************************************//
    //百度地图api的设置
    bmap: {
            center: [111.43066322374, 31.090018034923],  //初始化中心点坐标
            zoom: 5,   			//放大级别,越大越细致
            roam: true,		//是否可以漫游拖动
            mapStyle: {    //地图各个指标的json定义
            	//参考://http://lbsyun.baidu.com/custom/
                styleJson: [{
                    'featureType': 'water',  //水域
                    'elementType': 'all',
                    'stylers': {
                        'color': 'lightb'  //颜色
                        //'color': '1773c3'
                    }
                }, {
                    'featureType': 'land',  //陆地
                    'elementType': 'all',
                    'stylers': {
                        'color': '#f3f3f3'
                        //'color': '#091632'
                    }
                }, {
                    'featureType': 'railway',  //铁路
                    'elementType': 'all',
                    'stylers': {
                        'visibility': 'off'  //不显示
                    }
                }, {
                    'featureType': 'highway',  //高速路
                    'elementType': 'all',
                    'stylers': {
                        'visibility': 'off'
                    }
                }, {
                    'featureType': 'highway',  //高速路标签
                    'elementType': 'labels',
                    'stylers': {
                        'visibility': 'off'
                    }
                }, {
                    'featureType': 'arterial',  //道路
                    'elementType': 'geometry',
                    'stylers': {
                        'visibility': 'off'
                    }
                }, {
                    'featureType': 'arterial',
                    'elementType': 'geometry.fill',
                    'stylers': {
                        'color': '#fefefe'
                    }
                }, {
                    'featureType': 'poi',  //point of interesting
                    'elementType': 'all',
                    'stylers': {
                        'visibility': 'off'
                    }
                }, {
                    'featureType': 'green',   //绿地
                    'elementType': 'all',
                    'stylers': {
                        'visibility': 'off'
                    }
                }, {
                    'featureType': 'subway',  //地铁
                    'elementType': 'all',
                    'stylers': {
                        'visibility': 'off'
                    }
                }, {
                    'featureType': 'manmade',   //人造
                    'elementType': 'all',
                    'stylers': {
                        'color': '#d1d1d1'
                    }
                }, {
                    'featureType': 'local',
                    'elementType': 'all',
                    'stylers': {
                        'color': '#d1d1d1'
                    }
                }, {
                    'featureType': 'arterial',
                    'elementType': 'labels',
                    'stylers': {
                        'visibility': 'off'
                    }
                }, {
                    'featureType': 'district',  //行政区标签
                    'elementType': 'all',
                    'stylers': {
                        'color': '#eeeeee'
                    }
                }, {
                    'featureType': 'building',  //建筑
                    'elementType': 'all',
                    'stylers': {
                        'color': '#d1d1d1'
                    }
                }, {
                    'featureType': 'label',   	//标签字体填充
                    'elementType': 'labels.text.fill',
                    'stylers': {
                        'color': '#999999'
                    }
                }]
                //更多属性请参考:http://lbsyun.baidu.com/custom/
        }
    },
    //下面定义各个系列列表 子图画图的过程
    series : [
        {
            name: '全部',   //首先定义全部点用散点图画出来
            type: 'scatter',
            coordinateSystem: 'bmap',   //以地图为底图坐标
            data: convertData(data),  //数据来自于先前定义的函数
            symbolSize: function (val) {
                return val[2] / 2;  //用值的大小来调整点的大小
                //[name:'位置',value:[经度0 纬度 value]]的形式,其中value为第二维量
            },
            label: {
                normal: {
                    formatter: '{b}',
                    position: 'right',
                    show: false
                },
                emphasis: {
                    show: true
                }
            },
            itemStyle: {
                normal: {
                    color: 'green'   //点的颜色
                }
            }
        },
        {
            name: 'Top 3',  //定义一个排序显示,显示值最大前三个
            type: 'effectScatter',  //特效散点图显示
            coordinateSystem: 'bmap',
            data: convertData(data.sort(function (a, b) {
                return b.value - a.value;
            }).slice(0, 3)),   //拍出最大的三个值0,1,2  //从零开始是且为左包含
            symbolSize: function (val) {
                return val[2]/2;
            },
            showEffectOn: 'render',
            rippleEffect: {
                brushType: 'stroke',    //渲染的形式,还可选fill
                period:5,               //动画的时间。
                scale:3.5,              //大小
            },
            hoverAnimation: true,
            label: {
                normal: {
                    formatter: '{b}',
                    position: 'right',
                    show: true
                }
            },
            itemStyle: {
                normal: {
                    color: '#fb3c3c',
                    shadowBlur: 10,
                    shadowColor: '#db1c1c'
                }
            },
            encode: {                    //可以定义 data 的哪个维度被编码成什么
            tooltip: [2],               // 表示维度 2 会在 tooltip 中显示,也可以写入多维显示
            //label: 0                 // 表示 label 使用维度 0。
            },
            cursor:"help",             //光标类型,http://www.w3school.com.cn/cssref/pr_class_cursor.asp
            zlevel: 1
        },
        {
            name: 'Top 4-6',   //后续4-5名的显示
            type: 'effectScatter',
            coordinateSystem: 'bmap',
            data: convertData(data.sort(function (a, b) {
                return b.value - a.value;
            }).slice(3, 7)),
            symbolSize: function (val) {
                return val[2] / 2;
            },
            showEffectOn: 'render',
            rippleEffect: {
                brushType: 'stroke',
                scale:3.5,
            },
            hoverAnimation: true,
            label: {
                normal: {
                    formatter: '{b}',
                    position: 'right',
                    show: true
                }
            },
            itemStyle: {
                normal: {
                    color: '#1f6ed4',
                    shadowBlur: 7,
                    shadowColor: '#0f5ec4'
                }
            },
            encode: {                    //可以定义 data 的哪个维度被编码成什么
            tooltip: [2],              // 表示维度 2会在 tooltip 中显示。
            //label: 2                 // 表示 label 使用维度 2。
            },
            cursor:"help",
            zlevel: 1
        },
        //ref https://blog.csdn.net/luanpeng825485697/article/details/76832199

       //饼图统计
        {
            name: '汇总',
            type: 'pie', //饼图类型
            coordinateSystem: 'bmap',  //以地图为坐标系
            center: ['85%', '20%'],    //位置
            radius: '30%',  //饼的大小
            //title: 'daf',
            data:[
                 {name: '一级', value: 1},
                 {name: '二级', value: 3},
                 {name: '三级', value: 5},
                 {name: '四级', value: 7},
                 {name: '五级', value: 3},
                 ],
            itemStyle: {
                opacity:0.7,  //透明度
        },

        },

        //add time-serial chart
        {
            name:'位置1',
            //coordinateSystem: 'bmap',
            data: [15, 32, 21, 8],  //位置1的时序变化信息
            type: 'line',
            smooth: true   //平滑画线
        },
        {
            name:'位置2',
            //coordinateSystem: 'bmap',
            data: [7, 60, 30, 24],
            type: 'line',
            smooth: true
        },
    ]
};
//更多特性可查看配置项


