1. 图像直方图
直方图是一种对数据分布情况的图形表示,是一种二位统计图表。图像直方图,是用一表示数字图像中亮度分布的直方图,标绘了图像中每个亮度值的像素数。可以借以观察该直方图了解需要如何调整亮度分布的直方图。这种直方图中,横坐标的左侧为纯黑、较暗的区域,而右侧为较亮、纯白的区域。因此,一张较暗图片的图像直方图中的数据多集中于左侧和中间部分,而整体明亮、只有少数阴影的图像则相反。
- 横坐标:图像中各个像素点的灰度级;
- 纵坐标:具有该灰度级的像素个数;
直方图术语: - dims:需要统计的特征的数目。例如:dims=1,表示我们仅统计灰度值。
- bins:每个特征空间子区段的数据。
- range:统计灰度值范围,一般为[0, 255]
(1)使用opencv统计直方图
import cv2
import matplotlib.pyplot as plt
img = cv2.imread('./images/lena.jpg')
# img = cv2.cvtColor(img, cv2.COLOR_BGR2GRAY)
hist_b = cv2.calcHist([img], [0], None, [256], [0, 256])
hist_g = cv2.calcHist([img], [1], None, [256], [0, 256])
hist_r = cv2.calcHist([img], [2], None, [256], [0, 256])
# print(hist)
# print(type(hist)) # <class 'numpy.ndarray'>
# print(hist.size) # 256
# print(hist.shape) # (256, 1)
# n, bins, patches = plt.hist(img.flatten(), bins=256, range=[0, 255])
# n, bins, patches = plt.hist(hist, bins=256, range=[0, 255])
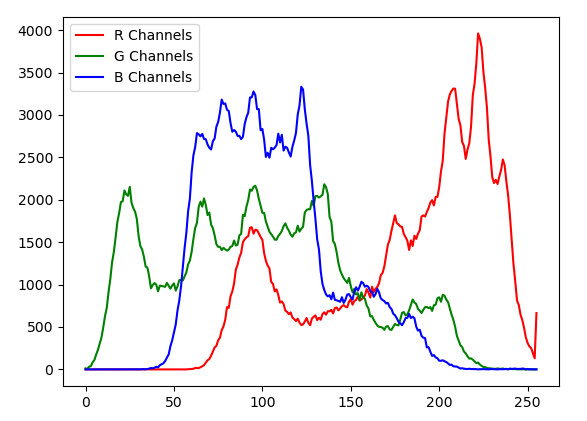
plt.plot(hist_r, color='red', label='R Channels')
plt.plot(hist_g, color='green', label='G Channels')
plt.plot(hist_b, color='blue', label='B Channels')
plt.legend()
plt.show()import cv2
lena = cv2.imread('./images/dog.jpg')
hist = cv2.calcHist([lena], [0], None, [256], [0, 256])
print(type(hist)) # <class 'numpy.ndarray'>
print(hist.size) # 256
print(hist.shape) # (256, 1)
print(hist)
(2)使用matplotlib统计直方图
import cv2
import matplotlib.pyplot as plt
img = cv2.imread('./images/lena.jpg')
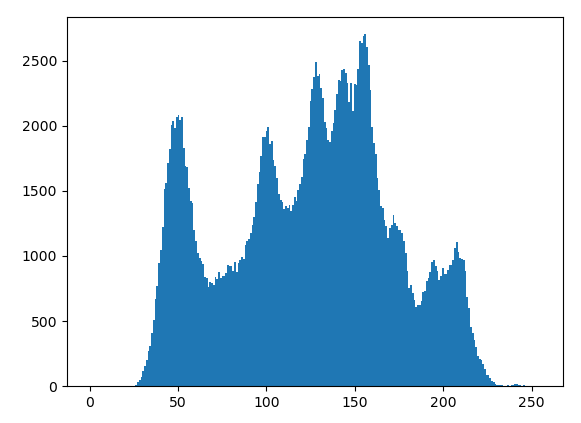
img = cv2.cvtColor(img, cv2.COLOR_BGR2GRAY)
hist = cv2.calcHist([img], [0], None, [256], [0, 256])
print(hist)
print(type(hist)) # <class 'numpy.ndarray'>
print(hist.size) # 256
print(hist.shape) # (256, 1)
# 当bins和range不传递的时候,会根据数据自动设置,默认bins好像是10
n, bins, patches = plt.hist(img.flatten(), bins=256, range=[0, 255])
# n, bins, patches = plt.hist(hist, bins=256, range=[0, 255])
# print('n', n)
plt.show()
- ndarray将多维变一维 x.ravel() 或 x.flatten()
2. 均值化直方图
直方图均衡化是通过拉伸像素强度的分布范围,使得在0~255灰阶上的分布更加均衡,提高了图像的对比度,达到改善图像主观视觉效果的目的。对比亮度较低的图像适合使用直方图均衡化方法来增强图像细节。
但是对于那些曝光良好,直方图表现均匀的图像,均值化的效果并不明显:
3. 参考
[1] Matplotlib菜鸟教程 https://www.runoob.com/matplotlib/matplotlib-tutorial.html
[2] Matplotlib.pyplot的官方API文档 https://matplotlib.org/stable/api/_as_gen/matplotlib.pyplot.hist.html#matplotlib.pyplot.hist