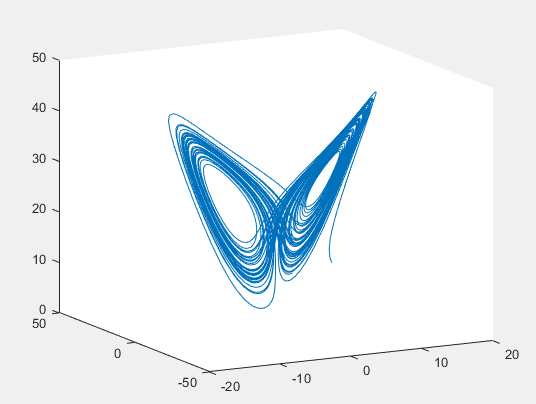
Lorenz系统
代码:
main.m
x0=[10 10 10];
tspan=[-30,30];
%p=[16 4 4];
p=[10 8/3 28];
[t,x]=ode45(@lorenz1,tspan,x0,[],p);
plot3(x(:,1),x(:,2),x(:,3))
lorenz1.m
function xprime = lorenz1(t,x,p);
%LORENZ: Computes the derivatives involved in solving the
%Lorenz equations.
sig=p(1); beta=p(2); rho=p(3);
xprime=[-sig*x(1) + sig*x(2); rho*x(1) - x(2) - x(1)*x(3); -beta*x(3) + x(1)*x(2)];
截图
Rosler系统
老师要的是这种效果

可是我找不到合适的初始点,不想找了

代码
main.m
x0=[0 -3 0];
tspan=[-30,30];
%p=[16 4 4];

p1=[0.2 0.2 2.5];
p2=[0.2 0.2 3.5];
p3=[0.2 0.2 4];
p4=[0.2 0.2 5];
[t1,x1]=ode45(@Roslerflow,tspan,x0,[],p1);
[t2,x2]=ode45(@Roslerflow,tspan,x0,[],p2);
[t3,x3]=ode45(@Roslerflow,tspan,x0,[],p3);
[t4,x4]=ode45(@Roslerflow,tspan,x0,[],p4);

subplot(2,2,1),plot3(x1(:,1),x1(:,2),x1(:,3));
subplot(2,2,2),plot3(x2(:,1),x2(:,2),x2(:,3));
subplot(2,2,3),plot3(x3(:,1),x3(:,2),x3(:,3));
subplot(2,2,4),plot3(x4(:,1),x4(:,2),x4(:,3));
Roslerflow.m
function xprime = Roslerflow(t,x,p);
%LORENZ: Computes the derivatives involved in solving the
%Lorenz equations.
a=p(1); b=p(2); c=p(3);
xprime=[-x(2)-x(3); x(1) +  a*x(2); b + x(3)*(x(1)-c) ];
Logistic混沌映射

模型讲解 https://blog.csdn.net/qiluofei/article/details/1837562
代码
clc;
clear;
x=0.1;
u=2:0.001:4;
for i=1:2000
    x=u.*(x-x.^2);
  if i>=1900
    plot(u,x);
    title('Logistic Map');
    xlabel('a');
    ylabel('X(n)');
    hold on;
  end
end
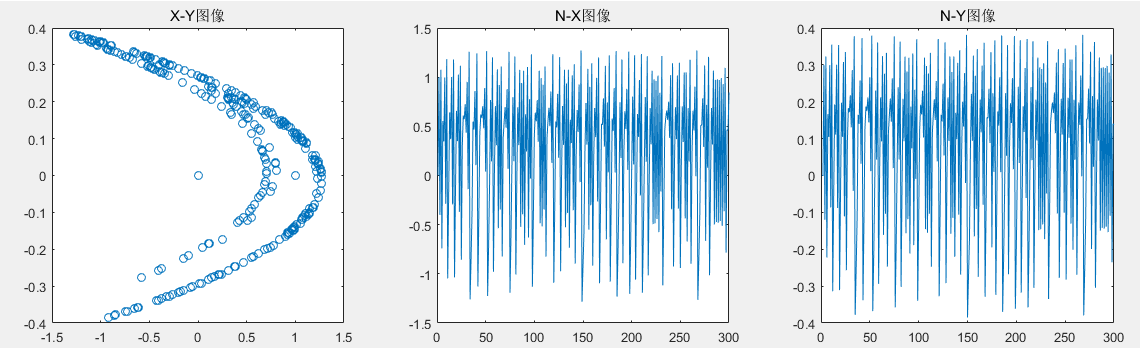
Henon Map
代码
%Henon Map
a = 1.4, b = 0.3;
x=[]
y=[]
x(1) = 0;
y(1) = 0;
n(1) = 1;
for i = 2:300
    n(i) = i;
    x(i) = 1-a* ( x(i-1)^2 )+y(i-1);
    y(i) = b*x(i-1);
end
subplot(1,3,1);
plot(x,y,'o');
title('X-Y图像') ;

subplot(1,3,2);
plot(n,x)
title('N-X图像') ;

subplot(1,3,3);
plot(n,y)
title('N-Y图像')
图像
IKeda Map
代码:
%Ikeda Map
a = 5.4, b = 0.9, c = 0.92;
x(1) = 0;
y(1) = 0;
w(1) = 0;
n(1) = 0;
for i = 2:400
    n(i) = i;
    x(i) = c + b*( x(i-1)*cos( w(i-1) ) - y(i-1) * sin( w(i-1) ) );
    y(i) = b*(  x(i-1)*sin( w(i-1) ) + y(i-1) * cos(w(i-1) )  );
    w(i) = 0.4-a/( 1+x(i-1)*x(i-1)+y(i-1)*y(i-1) );
end
subplot(2,2,[1,3]);
scatter(x,y);
title('X-Y图像') ;

subplot(2,2,2);
plot(n,x)
title('N-X图像') ;

subplot(2,2,4);
plot(n,y)
title('N-Y图像')
图像:
