转载自:https://blog.csdn.net/Simba_Wang/article/details/112258502
@
目录
前言
Telerik常常用于数据可视化以及高级渲染,这里放一下DevExpress和Telerik桌面控件库的比较,总的来说就是Telerik的DLL分类合理,量级较轻,适合我们这些新手开发。
现在我要绘制一个观察某一个学生不同时间的考试成绩的柱状图,下面我们就开始探索Telerik吧
一、进行控件的渲染
1. 拖入控件并命名
拖入Data Controls下的RadChartView,并设置Dock属性为Fill。
然后命名空间名称,这里为了方便起见就不命名了。
2. 设置标题样式
在Telerik中,一共有两个控制者管理着标题(Title),一个是RadChartView,另一个是RadChartView.ChartElement.TitleElement。它们分别管理者标题的行为(Behavior)以及样式(Style)。
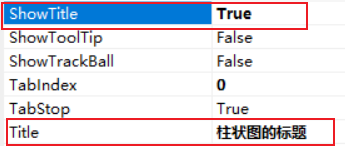
2.1 设置行为
Alt + Enter打开radChartView1的属性表,修改如下图所示的属性:
2.2 设置样式
#region 设置标题元素样式
// 设置标题显示位置:水平垂直均居中显示
this.radChartView1.ChartElement.TitleElement.TextAlignment =
    ContentAlignment.MiddleCenter;
// 设置标题字体:宋体
this.radChartView1.ChartElement.TitleElement.CustomFont = "STSongTi";
// 设置标题字体大小(float类型):20个像素
this.radChartView1.ChartElement.TitleElement.CustomFontSize = 20f;
#endregion
3. 设置网格样式
#region 设置网格
// 获取笛卡尔坐标系并显示
CartesianArea area = radChartView1.GetArea<CartesianArea>();
area.ShowGrid = true;
// 在笛卡尔坐标系下创建网格
CartesianGrid grid = area.GetGrid<CartesianGrid>();
grid.DrawHorizontalFills = false;
grid.BorderDashStyle = System.Drawing.Drawing2D.DashStyle.Dot;
#endregion
4. 设置Label的格式
由于柱状图上的Label默认是带有背景色和边框的,非常不友好,所以我们需要将其去除掉(设置透明色),代码如下图所示
// 首先创建一个“标签格式”的事件监听
this.radChartView1.LabelFormatting +=
    new ChartViewLabelFormattingEventHandler(radChartView1_LabelFormatting);
// “标签格式”事件监听
private void radChartView1_LabelFormatting(object sender, ChartViewLabelFormattingEventArgs e)
{
	//设置标签的背景
    e.LabelElement.BackColor = Color.Transparent;
    //设置标签的边框
    e.LabelElement.BorderColor = Color.Transparent;
}
5. 设置整幅图的色调
// 设置调色板为冷色系
this.radChartView1.Area.View.Palette = KnownPalette.Cold;
二、设置数据
1. 创建数据类
为了避免使用SQL语句,这里我们用ADO.NET实体对象模型的阉割版作为数据存储,也就是只建立一个实体对象Student。
其所具备的数据项(属性)如下代码体现:
class Student
{
    public string StudentID { get; set; }
    public string StudentName { get; set; }
    public double Score { get; set; }
    public string Time { get; set; }
}
2. 填充数据
private List<Student> GetData()
{
    List<Student> student_List = new List<Student>();

    student_List.Add(new Student { StudentID = "180502304", StudentName = "bntu", Score = 89, Time = "2018-1" });
    student_List.Add(new Student { StudentID = "180502304", StudentName = "bntu", Score = 65, Time = "2018-2" });
    student_List.Add(new Student { StudentID = "180502304", StudentName = "bntu", Score = 85, Time = "2018-3" });
    student_List.Add(new Student { StudentID = "180502304", StudentName = "bntu", Score = 93, Time = "2019-1" });
    student_List.Add(new Student { StudentID = "180502304", StudentName = "bntu", Score = 92, Time = "2019-2" });
    student_List.Add(new Student { StudentID = "180502304", StudentName = "bntu", Score = 75, Time = "2019-3" });
    student_List.Add(new Student { StudentID = "180502304", StudentName = "bntu", Score = 96, Time = "2020-1" });
    student_List.Add(new Student { StudentID = "180502304", StudentName = "bntu", Score = 78, Time = "2020-2" });
    student_List.Add(new Student { StudentID = "180502304", StudentName = "bntu", Score = 99, Time = "2020-3" });

    return student_List;
}
3. 加载柱状图
柱状图作为重要的三个部分:系列(Series)、Y轴(LinearAxis)和X轴(CategoricalAxis),所以我们分别来看如何设置这三个重要属性。
3.1 设置系列(Series)信息
#region 设置“系列(Series)”信息
BarSeries barSeries = new BarSeries();//定义一个柱状图集合
barSeries.ShowLabels = true;//显示值数据
foreach (var student in student_List)
{
    //添加值集合(Y, X)
    barSeries.DataPoints.Add(new CategoricalDataPoint(student.Score, student.Time));
}
this.radChartView1.Series.Add(barSeries);//添加柱状图集合
#endregion
3.2 设置Y轴信息
#region 添加垂直Y轴信息
LinearAxis verticalAxis = barSeries.VerticalAxis as LinearAxis;
verticalAxis.CustomFont = "Times New Roman";
verticalAxis.CustomFontSize = 10f;
// 设置Y轴刻度主间隔值,起始值(Minimum)默认为0
verticalAxis.MajorStep = 20;
#endregion
3.3 设置X轴信息
#region 添加水平X轴信息
CategoricalAxis horizontalAxis = barSeries.HorizontalAxis as CategoricalAxis;
// 设置X轴刻度值字体类型(倾斜/水平)
horizontalAxis.LabelFitMode = AxisLabelFitMode.Rotate;
// 柱体之间间距,Telerik会根据此值自动设置柱体宽度
horizontalAxis.GapLength = 0.5;
horizontalAxis.CustomFont = "Times New Roman";
horizontalAxis.CustomFontSize = 10f;
// 设置X轴上标签的边框,可以清晰地区分每一个X坐标
horizontalAxis.BorderColor = Color.FromArgb(209, 209, 209);
#endregion
四、完整项目
4.1 主要的Form1.cs文件代码
using System;
using System.Collections.Generic;
using System.ComponentModel;
using System.Data;
using System.Drawing;
using System.Linq;
using System.Text;
using System.Windows.Forms;
using Telerik.WinControls.UI;
using Telerik.Charting;

namespace Telerik测试_v3
{
    public partial class Form1 : Form
    {
        public Form1()
        {
            InitializeComponent();

            // 记得设置标题的行为(ShowTitle和Title)

            #region 设置标题元素样式
            // 设置标题显示位置:水平垂直均居中显示
            this.radChartView1.ChartElement.TitleElement.TextAlignment =
                ContentAlignment.MiddleCenter;
            // 设置标题字体:宋体
            this.radChartView1.ChartElement.TitleElement.CustomFont = "STSongTi";
            // 设置标题字体大小(float类型):20个像素
            this.radChartView1.ChartElement.TitleElement.CustomFontSize = 20f;
            #endregion

            #region 设置网格
            // 获取笛卡尔坐标系并显示
            CartesianArea area = radChartView1.GetArea<CartesianArea>();
            area.ShowGrid = true;
            // 在笛卡尔坐标系下创建网格
            CartesianGrid grid = area.GetGrid<CartesianGrid>();
            grid.DrawHorizontalFills = false;
            grid.BorderDashStyle = System.Drawing.Drawing2D.DashStyle.Dot;
            #endregion

            // 首先创建一个“标签格式”的事件监听
            this.radChartView1.LabelFormatting += new ChartViewLabelFormattingEventHandler(radChartView1_LabelFormatting);

            // 设置调色板为冷色系
            this.radChartView1.Area.View.Palette = KnownPalette.Cold;

            // 加载柱状图
            LoadBarChart(GetData());
        }

        private List<Student> GetData()
        {
            List<Student> student_List = new List<Student>();

            student_List.Add(new Student { StudentID = "180502304", StudentName = "bntu", Score = 89, Time = "2018-1" });
            student_List.Add(new Student { StudentID = "180502304", StudentName = "bntu", Score = 65, Time = "2018-2" });
            student_List.Add(new Student { StudentID = "180502304", StudentName = "bntu", Score = 85, Time = "2018-3" });
            student_List.Add(new Student { StudentID = "180502304", StudentName = "bntu", Score = 93, Time = "2019-1" });
            student_List.Add(new Student { StudentID = "180502304", StudentName = "bntu", Score = 92, Time = "2019-2" });
            student_List.Add(new Student { StudentID = "180502304", StudentName = "bntu", Score = 75, Time = "2019-3" });
            student_List.Add(new Student { StudentID = "180502304", StudentName = "bntu", Score = 96, Time = "2020-1" });
            student_List.Add(new Student { StudentID = "180502304", StudentName = "bntu", Score = 78, Time = "2020-2" });
            student_List.Add(new Student { StudentID = "180502304", StudentName = "bntu", Score = 99, Time = "2020-3" });

            return student_List;
        }

        private void LoadBarChart(List<Student> student_List)
        {
            #region 设置“系列(Series)”信息
            BarSeries barSeries = new BarSeries();//定义一个柱状图集合
            barSeries.ShowLabels = true;//显示值数据
            foreach (var student in student_List)
            {
                //添加值集合(Y, X)
                barSeries.DataPoints.Add(new CategoricalDataPoint(student.Score, student.Time));
            }
            this.radChartView1.Series.Add(barSeries);//添加柱状图集合
            #endregion

            #region 添加垂直Y轴信息
            LinearAxis verticalAxis = barSeries.VerticalAxis as LinearAxis;
            verticalAxis.CustomFont = "Times New Roman";
            verticalAxis.CustomFontSize = 10f;
            verticalAxis.MajorStep = 20;//设置Y轴刻度间隔值
            #endregion

            #region 添加水平X轴信息
            CategoricalAxis horizontalAxis = barSeries.HorizontalAxis as CategoricalAxis;
            // 设置X轴刻度值字体类型(倾斜/水平)
            horizontalAxis.LabelFitMode = AxisLabelFitMode.Rotate;
            // 柱体之间间距,间接设置柱体宽度
            horizontalAxis.GapLength = 0.5;
            horizontalAxis.CustomFont = "Times New Roman";
            horizontalAxis.CustomFontSize = 10f;
            // 设置X轴上标签的边框,可以清晰地区分每一个X坐标
            horizontalAxis.BorderColor = Color.FromArgb(209, 209, 209);
            #endregion
        }

        public void radChartView1_LabelFormatting(object sender, ChartViewLabelFormattingEventArgs e)
        {
            e.LabelElement.BackColor = Color.Transparent;//设置值数据背景色
            e.LabelElement.BorderColor = Color.Transparent;//设置值数据边框色
        }
    }
}
4.2 项目压缩包下载
百度网盘地址;提取码:hi5p;