1. matplotlib ->绘图
2. numpy -> 处理数值型数组
3. pandas -> 处理字符串, 时间序列、字典等
三、pandas 学习
numpy 帮我们处理数值型数据, pandas 可以帮我们处理字符串、时间序列等。
一、常用数据类型
-
Series 一维, 由 "索引" 跟 "值" 组成。
-
使用列表或numpy对象
pd.Series([1,2,3,4,5], index=list("abcde"))
-
import pandas as pd
pd.Series([1,2,3,4,5], index=list("abcde"))
# 结果
a    1
b    2
c    3
d    4
e    5
dtype: int64
----不指明索引默认使用 0,1,2,3,4 下标
----第一个参数可以是nump 对象
-
使用字典对象, key 作为索引, value 作为值
In [62]: dict_tmp = {"name": "小明", "age":18} In [63]: pd.Series(dict_tmp) Out[63]: name 小明 age 18 dtype: object -
切片和索引
a = pd.Series(dict_tmp)a[0] # 下标取值 a["name"] # 索引取值 --------- In [78]: a[["name", "age"]] # 根据索引取多个 Out[78]: name 小明 age 18 dtype: object --------- In [79]: a[[0, 1]] # 根据下标取多个 Out[79]: name 小明 age 18 dtype: object --------- In [81]: a = pd.Series(range(10)) In [82]: a[a> 5] # 布尔索引 Out[82]: 6 6 7 7 8 8 9 9 dtype: int64切片和python一样
5. pandas读取外部数据
pd.read_csv() # 读取csv
import pandas as pd
df = pd.read_csv("./data/1.csv")# 有好多read_... 方法
print(df)

####结果
         品名  最低价   平均价  最高价     规格 单位        发布日期
0       大白菜  0.4  0.50  0.6     存储  斤  2021-03-25 NaN
1       大白菜  0.7  0.75  0.8      新  斤  2021-03-25 NaN
2       娃娃菜  0.6  0.75  0.9    大小  斤  2021-03-25 NaN
3        芹菜  0.8  0.90  1.0      鲁  斤  2021-03-25 NaN
4        菠菜  0.7  1.00  1.3   长杆冀  斤  2021-03-25 NaN
5        番茄  1.0  1.40  1.8    川鲁蒙  斤  2021-03-25 NaN
6    番茄(精品)  1.5  1.75  2.0     普通  斤  2021-03-25 NaN
7        黄瓜  1.6  1.90  2.2  蒙辽袋鲁  斤  2021-03-25 NaN
8   黄瓜(鲜干花)  2.6  2.90  3.2      冀  斤  2021-03-25 NaN
9       小黄瓜  4.0  5.50  7.0   旱荷兰  斤  2021-03-25 NaN
10       茄子  1.2  1.70  2.2    鲁冀  斤  2021-03-25 NaN
11       架豆  2.6  3.70  4.8     冀  斤  2021-03-25 NaN
12       尖椒  1.4  1.95  2.5  冀晋/鲁新  斤  2021-03-25 NaN
13      柿子椒  1.4  1.85  2.3    鲁新  斤  2021-03-25 NaN
14       土豆  0.6  0.80  1.0     冀  斤  2021-03-25 NaN
15      新土豆  0.7  0.95  1.2   陕冀云新  斤  2021-03-25 NaN
16      黄葱头  0.8  1.00  1.2    蒙甘  斤  2021-03-25 NaN
17      红葱头  0.9  1.15  1.4     普通  斤  2021-03-25 NaN
18        葱  3.5  3.75  4.0  冀/苏鲁闽  斤  2021-03-25 NaN
19      吊冬瓜  1.7  1.95  2.2      桂  斤  2021-03-25 NaN
DataFrame 二维, Series容器
1.创建
In [4]: import numpy as np

In [5]: import pandas as pd

In [6]: a = pd.DataFrame(np.arange(12).reshape(3,4))

In [7]: a
Out[7]:
   0  1   2   3  # 列索引
0  0  1   2   3
1  4  5   6   7
2  8  9  10  11

#行索引
- 参数index, 行索引
- 参数columns, 列索引
- dtype
In [20]: b = pd.DataFrame(np.arange(12).reshape(3,4), index=list("abc"), columns=list("wxyz"))

In [21]: b
Out[21]:
   w  x   y   z
a  0  1   2   3
b  4  5   6   7
c  8  9  10  11
传入字典
方式一、
In [24]: a = {"name": ["小红", "小明", "小刚"], "age": [18,19,20]}

In [25]: b = pd.DataFrame(a)

In [26]: b
Out[26]:
  name  age
0   小红   18
1   小明   19
2   小刚   20
方式二、
In [31]: c = [{"name": "小明","age": 18}, {"name":"小刚", "age":20}]

In [32]: d = pd.DataFrame(c)

In [33]: d
Out[33]:
  name  age
0   小明   18
1   小刚   20
2. DataFrame 操作
a.head(3) # 显示前几行, 默认前5行
a.tail(3) # 显示末尾几行, 默认后5行
a.info() # 查看信息概览: 行数,列数,列索引,列非空值个数,列类型,内存占用
a.describe() # 快速综合统计结果: 技术,均值,标准差,最大值,四分位数, 最小值
a.sort_values(by="排序的字段", acsending=True) # 升序排序,并指明排序字段
a[:] # 切片
d[:1] # 取值行
------
  name  age
0   小明   18

d[:1]["age"] # 取行+列
d["age"] # 取列
根据索引取值:
b.loc[[0,1], [1,2]] # 通过标签索引行数据, 选取第0,1行, 第1,2列,这里0,1 是指索引值
z = pd.DataFrame(np.arange(12).reshape(3,4), index=list("abc"), columns=list("wxyz"))

z.loc["a",:] # 取第a行的所有列z.loc[["a", "b"],:]
z.loc["a":"c",["w", "z"]] # 从第a行到第c行(c可以取到)的w,z列,
根据位置获取行
z.iloc[[0,2], [2,1]] # 这里的 0,2 1 指得是行数和列数
z.iloc[1:,:2] # 取第一行之后,第二列之前的所有列
# 当列索引和行索引相同的时候默认取得是列
b = pd.DataFrame(np.arange(12).reshape(3,4))
------
Out[90]:
   0  1   2   3
0  0  1   2   3
1  4  5   6   7
2  8  9  10  11

b[0] # 取值
--------
Out[91]:
0    0
1    4
2    8
Name: 0, dtype: int32
In [41]: d.describe()
Out[41]:
             age
count   2.000000
mean   19.000000
std     1.414214
min    18.000000
25%    18.500000
50%    19.000000
75%    19.500000
max    20.000000

In [42]: d.info()
<class 'pandas.core.frame.DataFrame'>
RangeIndex: 2 entries, 0 to 1
Data columns (total 2 columns):
 #   Column  Non-Null Count  Dtype
---  ------  --------------  -----
 0   name    2 non-null      object
 1   age     2 non-null      int64
dtypes: int64(1), object(1)
memory usage: 160.0+ bytes
布尔索引
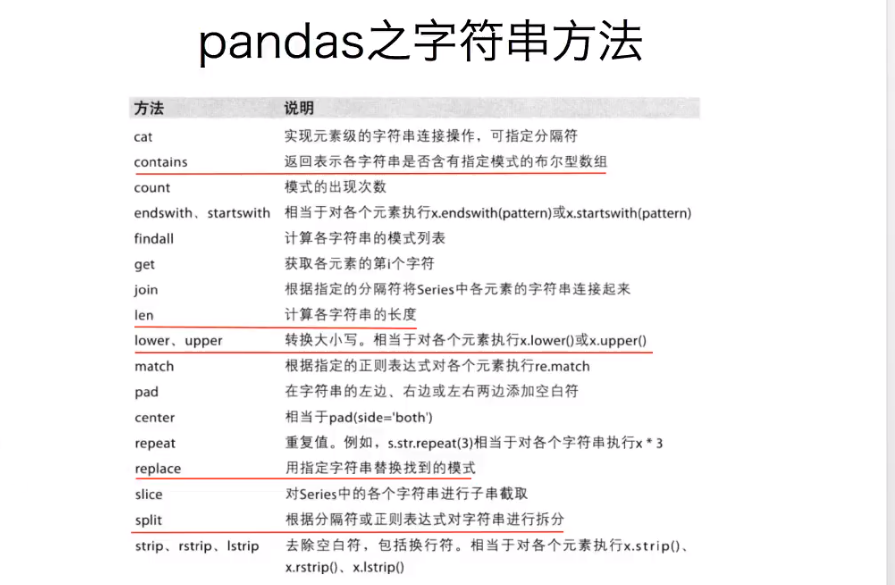
df[ (df["品名"].str.len() > 2) & (df["品名"].str.len() < 4) ]
# 选取品名长度 > 2 并且<4 的值, 在布尔索引中将每一个判断条件用() 括起来
 (df["品名"].str.len() > 2)
    &
 	(df["品名"].str.len() < 4)

.tolist # 将其转换为一个列表
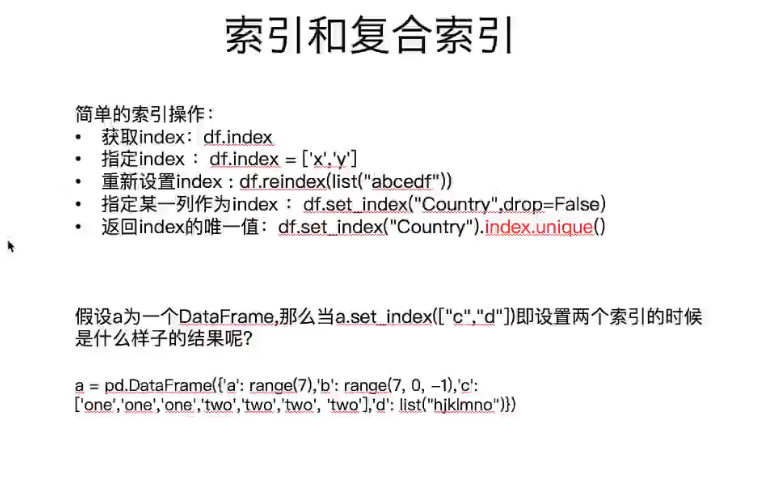
查看index
a.index # 可以迭代的, 也可以用切片
a.colums #查看列索引
查看值
a.values # 可以遍历,切片索引
缺失数据处理:
-
NaN
pd.isnull() # 判断为nan的方式
pd.notnull() # 判断不为nan的方式

d[pd.notnull(d["w"]) # 选择d, w列不为nan的列


 a[pd.notnull(a["w"])] # 选取w列不为 Nan 的列
删除
a.dropna(axis=1. how="any", inplac=True)
# 删除包含nan的列
# how = "any" 指只要有nan就删掉, how="all" 指全部是Nan的时候才删除
# inplace =True 指修改源数据, =False 不修改源数据
替换
a.fillna(100) # 将100 放到为 nan的位置 # 一般填充均值或中位数 a["w"] = a["w"].fillna(t2["w"].mean()) # 只修改w这一列, 并将这一列的结果赋给w这一列 -
0
使用布尔索引给0重新赋值,如果是确定数据确实的时候一般赋值位 Nan
数据合并
.join (行索引,数据组合)
默认情况下他是把行索引相同的数据合并到一起。
In [44]: t1
Out[44]:
     w    x    y    z
A  1.0  1.0  1.0  1.0
B  1.0  1.0  1.0  1.0

In [45]: t2
Out[45]:
     a    b    c
A  0.0  0.0  0.0
B  0.0  0.0  0.0
C  0.0  0.0  0.0

In [46]: t1.join(t2) # 以t1 为基准,没有的赋值位Nan
Out[46]:
     w    x    y    z    a    b    c
A  1.0  1.0  1.0  1.0  0.0  0.0  0.0
B  1.0  1.0  1.0  1.0  0.0  0.0  0.0

# 以join 前的为基准,没有的赋值位Nan
# 不能有相同的列 标识 (cloumns)
.merge (列索引, 数据组合)
In [135]: t1
Out[135]:
     a    b    c    d
z  1.0  1.0  1.0  1.0
y  4.0  1.0  1.0  1.0
0  5.0  6.0  7.0  8.0

In [136]: t2
Out[136]:
   f  a  g
a  0  1  2
b  3  4  5
c  6  7  8

In [137]: t1.merge(t2, on="a", how="inner") # 根据a列合并,并且根据列项上的值合并, 之合并相等的, on 参数可以去掉, how="inner" 表示内连接, 默认为内连接,  how="outer" 指外连接, how="left" 左连接, how="right" 右链接
Out[137]:
     a    b    c    d  f  g
0  1.0  1.0  1.0  1.0  0  2
1  4.0  1.0  1.0  1.0  3  5


In [141]: t1.merge(t2, on="a", how="outer") # 以a 为基准的外连接
Out[141]:
     a    b    c    d    f    g
0  1.0  1.0  1.0  1.0  0.0  2.0
1  4.0  1.0  1.0  1.0  3.0  5.0
2  5.0  6.0  7.0  8.0  NaN  NaN
3  7.0  NaN  NaN  NaN  6.0  8.0

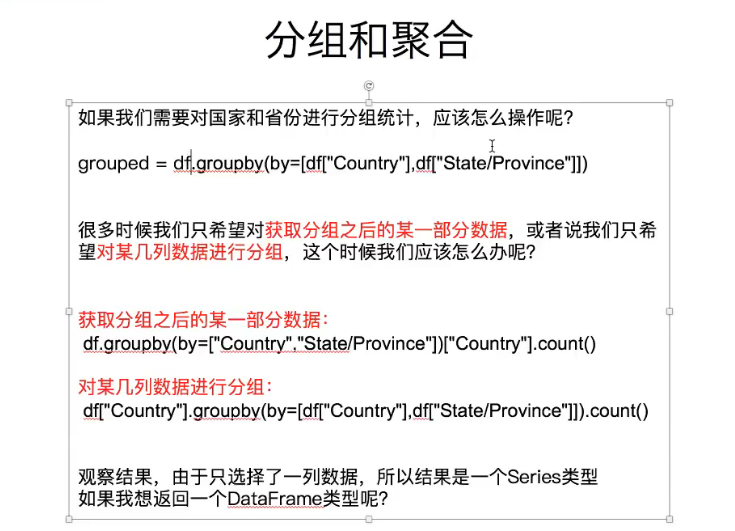
分组和聚合
.groupby(by="分组字段") # by = [] # 对多个字段分组


时间序列
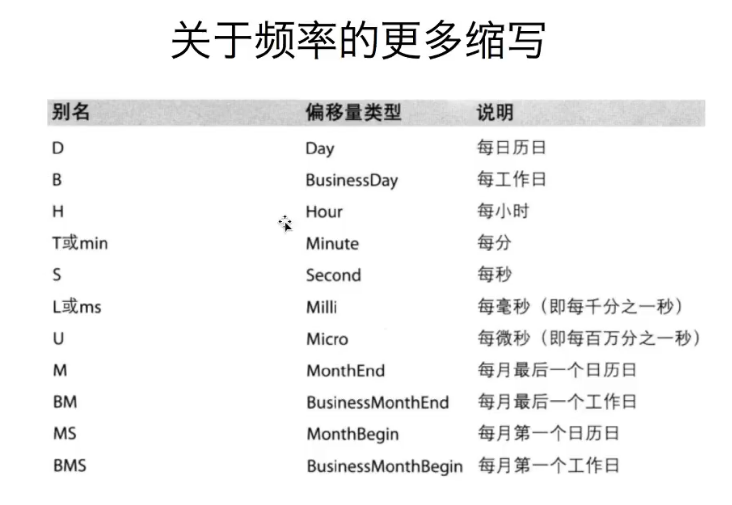
pd.data_range(start=None, end=None, periods=None, freq="D")
start 开始时间
end 结束时间
periods 个数
freq 单位
例1: 从2018 年12月1号到2019年1月1号以天为单位的时间
In [223]: pd.date_range(start="20181201", end="20190101", freq="D")
Out[223]:
DatetimeIndex(['2018-12-01', '2018-12-02', '2018-12-03', '2018-12-04',
               '2018-12-05', '2018-12-06', '2018-12-07', '2018-12-08',
               '2018-12-09', '2018-12-10', '2018-12-11', '2018-12-12',
               '2018-12-13', '2018-12-14', '2018-12-15', '2018-12-16',
               '2018-12-17', '2018-12-18', '2018-12-19', '2018-12-20',
               '2018-12-21', '2018-12-22', '2018-12-23', '2018-12-24',
               '2018-12-25', '2018-12-26', '2018-12-27', '2018-12-28',
               '2018-12-29', '2018-12-30', '2018-12-31', '2019-01-01'],
              dtype='datetime64[ns]', freq='D')
例2: 从2018 年12月1号到2019年1月1号以天为单位的时间, 间隔5天
In [224]: pd.date_range(start="20181201", end="20190101", freq="5D")
Out[224]:
DatetimeIndex(['2018-12-01', '2018-12-06', '2018-12-11', '2018-12-16',
               '2018-12-21', '2018-12-26', '2018-12-31'],
              dtype='datetime64[ns]', freq='5D')
例3: 间隔5个月
In [225]: pd.date_range(start="20181201", end="20191201", freq="5M")
Out[225]: DatetimeIndex(['2018-12-31', '2019-05-31', '2019-10-31'], dtype='datetime64[ns]', freq='5M')
例4: 从2018 年12月1号起每隔5个月取一个共取10个
In [226]: pd.date_range(start="20181201", periods=10, freq="5M")
Out[226]:
DatetimeIndex(['2018-12-31', '2019-05-31', '2019-10-31', '2020-03-31',
               '2020-08-31', '2021-01-31', '2021-06-30', '2021-11-30',
               '2022-04-30', '2022-09-30'],
              dtype='datetime64[ns]', freq='5M')

字符串转换为时间序列
pd.to_datetime("指明列", format="")
一般format 不需要指明,当时间字符串里有中文的时候需要指明。
format 和python 时间戳格式化一样
将秒级时间转换为月级( 降采样, 反之为升采样)
.resample("频率单位") # 注意这里只能转换,index, 所以想转换之前先使用set_index 将相应的列设置为index
index 操作
