• Echarts饼图页面加载后默认凸出某块


    代码:

    <script type="text/javascript">
            var myChart = echarts.init(document.getElementById("echarts_demo"));
            window.onresize = myChart.resize;
    
            option = {
                //backgroundColor: '#fff',
                color: ['blue','green'],
                // tooltip: {formatter: "{d}%"},
                series: [
                    {
                        type: 'pie',
                        /* //用于理解
                        radius: [0, '90%'],
                        silent: true,//当有tooltip---formatter时,阻止第一个圈formatter内容的出现
                        label: {
                            normal: {show: false},
                        },
                        data: [{
                            value: 1,
                            name: '',
                            itemStyle: {color: '#ddd'},
                        }] */
                    },
                    {
                        type: 'pie',
                        radius: ['40%', '60%'],
                        hoverOffset: 20,
                        
                        label: {
                            normal: {
                                show: false,
                                position:'center'
                            },
                            emphasis:{
                                show:true,
                                textStyle: {
                                    fontSize: '15',
                                    fontWeight: 'bold'
                                }
                            }
                        },
                        data:[
                            {value:600, name:'22:00-8:00'},
                            {value:270, name:'8:00-12:30'},
                            {value:90, name:'12:30-14:00'},
                            {value:480, name:'14:00-22:00'},
                        ]
                    } 
                ]
            };
    
            myChart.setOption(option);
    //设置默认选中高亮部分 myChart.dispatchAction({ type: 'highlight', seriesIndex: 1, dataIndex: 0 }); myChart.on('mouseover', function(e) { //当检测到鼠标悬停事件,取消默认选中高亮 myChart.dispatchAction({ type: 'downplay', seriesIndex: 1, dataIndex: 0 }); //高亮显示悬停的那块 myChart.dispatchAction({ type: 'highlight', seriesIndex: 1, dataIndex: e.dataIndex }); }); //检测鼠标移出后显示之前默认高亮的那块 myChart.on('mouseout', function(e) { myChart.dispatchAction({ type: 'highlight', seriesIndex: 1, dataIndex: 0 }); }); </script>

    默认显示效果:
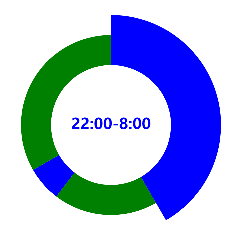
     

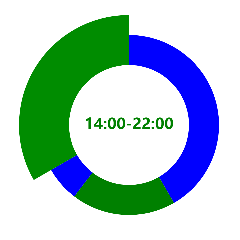
    移入其他块悬停效果:


    想看更多Dome,请去ECharts官网:https://www.echartsjs.com/index.html


    注:Echarts隐藏之后的显示问题
    给盛装Echarts图的div容器高、宽(高、宽要写成内联)即可!
  • 相关阅读:
    zookeeper笔记整理(二)
    zookeeper笔记整理(一)
    SpringBoot源码分析(三)整合MyBatis
    四、MyBatis终结篇(补充中...)
    三、SpringMVC终结篇(补充中...)
    二、SpringAOP终结篇(补充中...)
    一、SpringIOC终结篇(补充中...)
    跳出初学MySQL知识的原理整理(一)
    SpringBoot源码分析(二)启动原理
    一文带你学会基于SpringAop实现操作日志的记录
  • 原文地址:https://www.cnblogs.com/Salicejy/p/10839174.html
Copyright © 2020-2023  润新知