matplotlib_200730系列---12、图中图
一、总结
一句话总结:
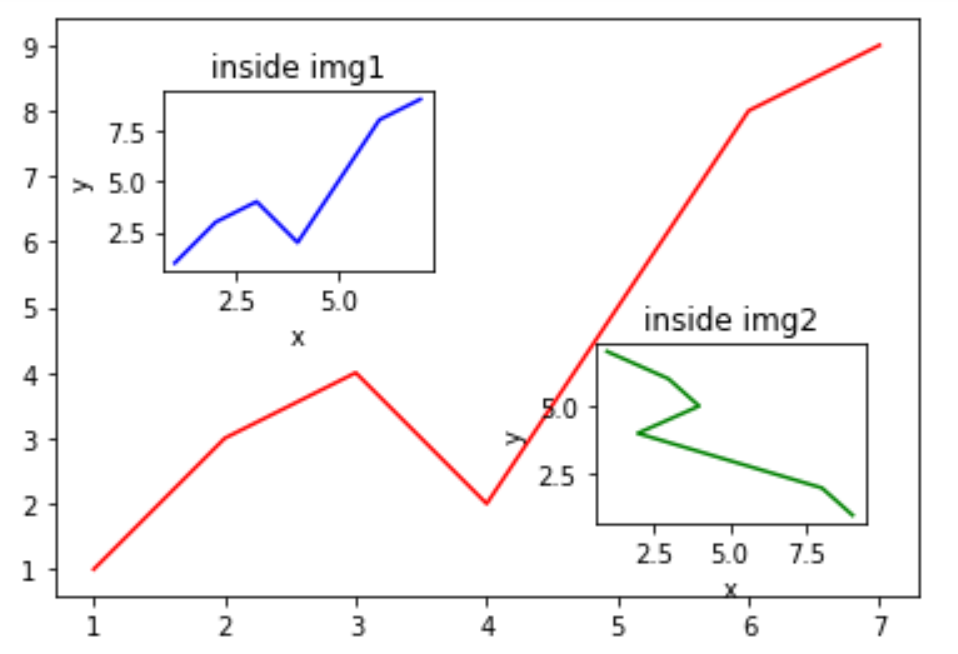
主要是改变axis的位置:ax1=fig.add_axes([left,bottom,width,height])
# 小图1(主要是改变 left,bottom,width,height)
left,bottom,width,height=0.2,0.55,0.25,0.25
ax2=fig.add_axes([left,bottom,width,height])
ax2.plot(x,y,'b')
ax2.set_xlabel('x')
ax2.set_ylabel('y')
ax2.set_title('inside img1')
二、图中图
博客对应课程的视频位置:
import matplotlib.pyplot as plt
import matplotlib.gridspec as gridspec


fig=plt.figure()
x=[1,2,3,4,5,6,7]
y=[1,3,4,2,5,8,9]

# 大图
left,bottom,width,height=0.1,0.1,0.8,0.8
ax1=fig.add_axes([left,bottom,width,height])
ax1.plot(x,y,'r')
axl.set_xlabel('x')
axl.set_ylabel('y')
axl.set_title('title')

# 小图1(主要是改变 left,bottom,width,height)
left,bottom,width,height=0.2,0.55,0.25,0.25
ax2=fig.add_axes([left,bottom,width,height])
ax2.plot(x,y,'b')
ax2.set_xlabel('x')
ax2.set_ylabel('y')
ax2.set_title('inside img1')

# 小图2
plt.axes([.6,0.2,0.25,0.25])
plt.plot(y[::-1],x,'g')
plt.xlabel('x')
plt.ylabel('y')
plt.title('inside img2')


plt.show()
