上篇《基于WebForm+EasyUI的业务管理系统形成之旅 -- 首页快捷方式》,主要介绍通过添加首页快捷方式,快速进入各个应用菜单功能.
将常用的菜单功能作为快捷方式,避免由于寻找诸多的菜单树,浪费时间。在添加页面时根据人员权限不同,左侧功能菜单节点不同。
本篇将介绍系统中数据统计所采用的工具。
一、HighCharts数据统计
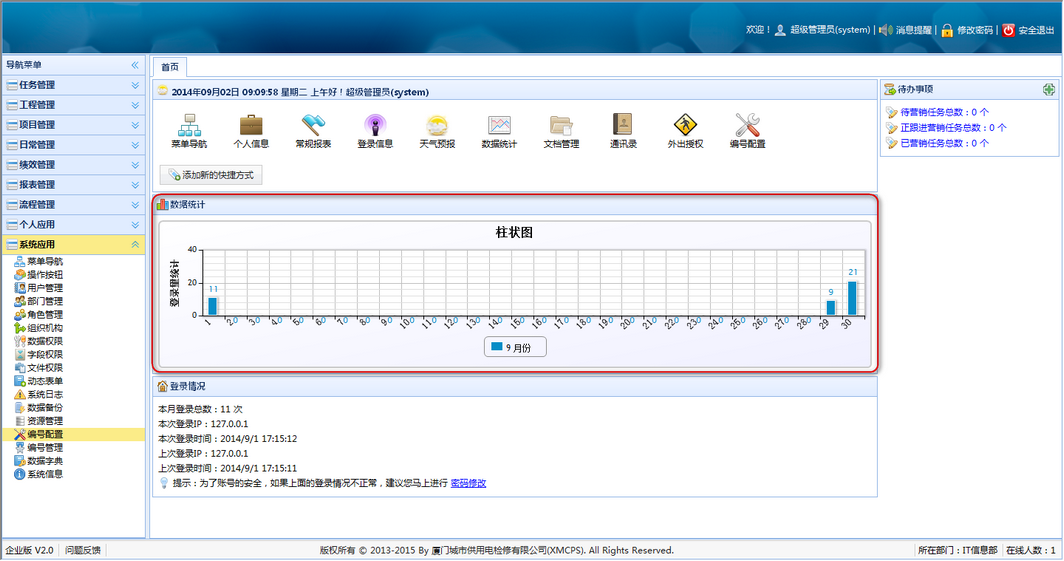
登录量统计,如下图所示。
通过HighCharts统计人员登录系统次数,代码如下
 1         function HChartsResize(obj,_height,_width) {
 2             var H_width;
 3             if (flag == 0) {
 4                 H_width= $('.box-content').width() + _width;
 5             } else {
 6                 H_width = _width;
 7             }
 8             var month = <%=strmonth %> + " 月份"; //月份
 9             var V_Data = <%=sbDate %>;
10             var V_DataCount = <%=sbDateCount %>;
11             chart = new Highcharts.Chart({
12                 chart: {
13                     renderTo: obj,          //放置图表的容器
14                     plotBackgroundColor: "#fff",
15                     plotBorderWidth: null,
16                      H_width,
17                     height: _height,
18                     defaultSeriesType: 'column'   //图表类型line, spline, area, areaspline, column, bar, pie, scatter
19                 },
20                 title: {
21                     text: '柱状图'
22                 },
23                 xAxis: {//X轴数据
24                     categories: V_Data,
25                     labels: {
26                         rotation: -45, //字体倾斜
27                         align: 'right',
28                         style: { font: 'normal 13px 宋体' }
29                     }
30                 },
31                 yAxis: {//Y轴显示文字
32                     title: {
33                         text: '登录量统计'
34                     }
35                 },
36                 tooltip: {
37                     enabled: true,
38                     formatter: function () {
39                         return '<b>' + this.x + '号</b><br/>' + this.series.name + ': ' + Highcharts.numberFormat(this.y, 0) + "次";
40                     }
41                 },
42                 plotOptions: {
43                     column: {
44                         dataLabels: {
45                             enabled: true
46                         },
47                         enableMouseTracking: true//是否显示title
48                     }
49                 },
50                 series: [{
51                     name: month,
52                     data: V_DataCount
53                 }]
54             });
55             }
二、StimulSoft Report 数据统计
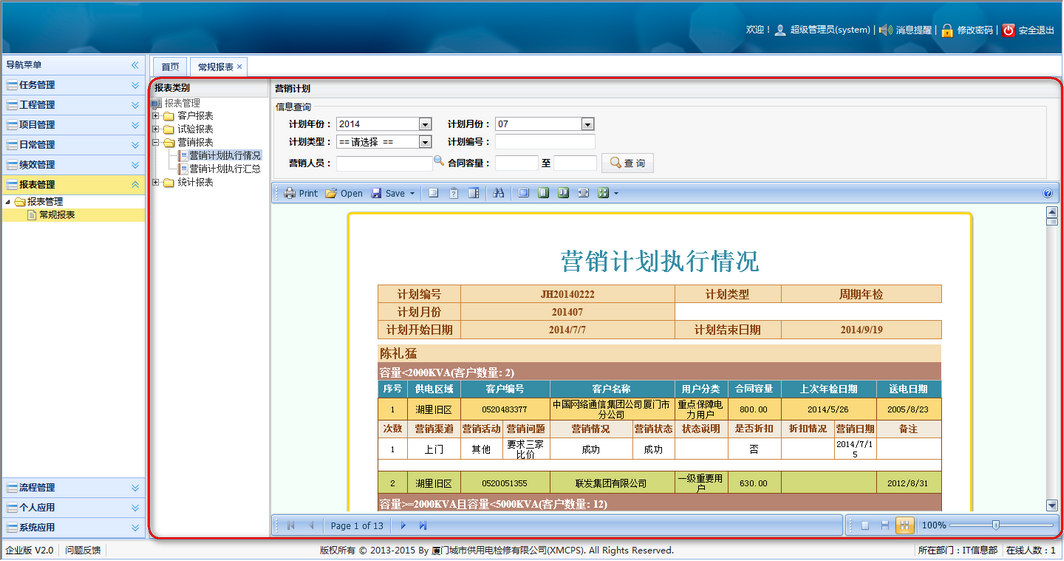
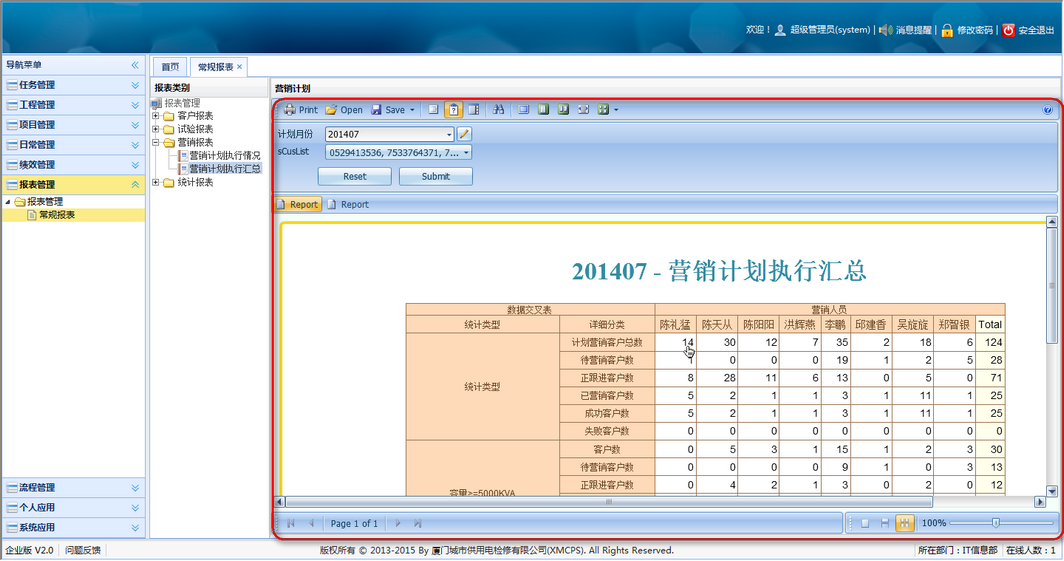
计划执行数据统计情况,如图所示
将统计数据作为详细数据筛选条件跳转到详细数据
详细操作可以登录Stimulsoft Report 官网了解。


