特征提取:
    特征降维的手段
    抛弃对结果没有联系的特征
    抛弃对结果联系较少的特征
    以这种方式,降低维度

数据集的特征过多,有些对结果没有任何关系,
这个时候,将没有关系的特征删除,反而能获得更好的预测结果

下面使用决策树,预测泰坦尼克号幸存情况,
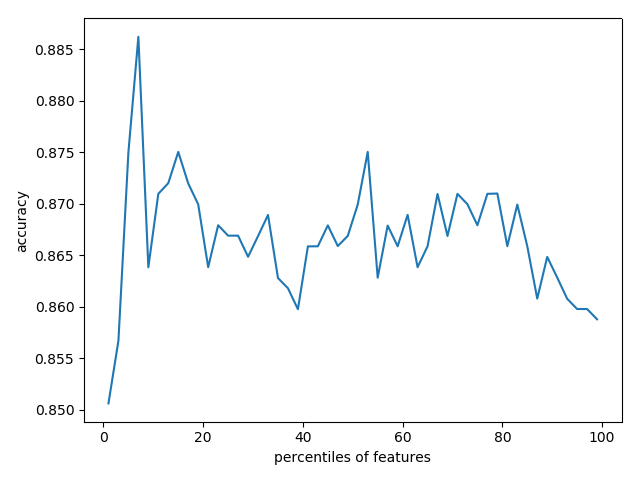
对不同百分比的筛选特征,进行学习和预测,比较准确率
python3学习使用api
使用到联网的数据集,我已经下载到本地,可以到我的git中下载数据集
git: https://github.com/linyi0604/MachineLearning
代码:
 1 import pandas as pd
 2 from sklearn.cross_validation import train_test_split
 3 from sklearn.feature_extraction import DictVectorizer
 4 from sklearn.tree import DecisionTreeClassifier
 5 from sklearn import feature_selection
 6 from sklearn.cross_validation import cross_val_score
 7 import numpy as np
 8 import pylab as pl
 9
10 '''
11 特征提取:
12     特征降维的手段
13     抛弃对结果没有联系的特征
14     抛弃对结果联系较少的特征
15     以这种方式,降低维度
16
17 数据集的特征过多,有些对结果没有任何关系,
18 这个时候,将没有关系的特征删除,反而能获得更好的预测结果
19
20 下面使用决策树,预测泰坦尼克号幸存情况,
21 对不同百分比的筛选特征,进行学习和预测,比较准确率
22 '''
23
24 # 1 准备数据
25 titanic = pd.read_csv("../data/titanic/titanic.txt")
26 # 分离数据特征与目标
27 y = titanic["survived"]
28 x = titanic.drop(["row.names", "name", "survived"], axis=1)
29 # 对缺失值进行补充
30 x['age'].fillna(x['age'].mean(), inplace=True)
31 x.fillna("UNKNOWN", inplace=True)
32
33 # 2 分割数据集 25%用于测试 75%用于训练
34 x_train, x_test, y_train, y_test = train_test_split(x, y, test_size=0.25, random_state=33)
35
36 # 3 类别型特征向量化
37 vec = DictVectorizer()
38 x_train = vec.fit_transform(x_train.to_dict(orient='record'))
39 x_test = vec.transform(x_test.to_dict(orient='record'))
40 # 输出处理后向量的维度
41 # print(len(vec.feature_names_))  # 474
42
43 # 4 使用决策树对所有特征进行学习和预测
44 dt = DecisionTreeClassifier(criterion='entropy')
45 dt.fit(x_train, y_train)
46 print("全部维度的预测准确率:", dt.score(x_test, y_test))  # 0.8206686930091185
47
48 # 5 筛选前20%的特征,使用相同配置的决策树模型进行评估性能
49 fs = feature_selection.SelectPercentile(feature_selection.chi2, percentile=20)
50 x_train_fs = fs.fit_transform(x_train, y_train)
51 x_test_fs = fs.transform(x_test)
52 dt.fit(x_train_fs, y_train)
53 print("前20%特征的学习模型预测准确率:", dt.score(x_test_fs, y_test))     # 0.8237082066869301
54
55 # 6 通过交叉验证 按照固定间隔百分比筛选特征, 展示性能情况
56 percentiles = range(1, 100, 2)
57 results = []
58 for i in percentiles:
59     fs = feature_selection.SelectPercentile(feature_selection.chi2, percentile=i)
60     x_train_fs = fs.fit_transform(x_train, y_train)
61     scores = cross_val_score(dt, x_train_fs, y_train, cv=5)
62     results = np.append(results, scores.mean())
63 # print(results)
64 '''
65 [0.85063904 0.85673057 0.87501546 0.88622964 0.86284271 0.86489384
66  0.87303649 0.86689342 0.87098536 0.86690373 0.86895485 0.86083282
67  0.86691404 0.86488353 0.86895485 0.86792414 0.86284271 0.86995465
68  0.86486291 0.86385281 0.86384251 0.86894455 0.86794475 0.86690373
69  0.86488353 0.86489384 0.86590394 0.87300557 0.86995465 0.86793445
70  0.87097506 0.86998557 0.86692435 0.86892393 0.86997526 0.87098536
71  0.87198516 0.86691404 0.86691404 0.87301587 0.87202639 0.8648423
72  0.86386312 0.86388374 0.86794475 0.8618223  0.85877139 0.86285302
73  0.86692435 0.8577819 ]
74 '''
75 # 找到最佳性能的筛选百分比
76 opt = np.where(results == results.max())[0][0]
77 print("最高性能的筛选百分比是:%s%%" % percentiles[opt])  # 7
78
79 pl.plot(percentiles, results)
80 pl.xlabel("特征筛选的百分比")
81 pl.ylabel("准确率")
82 pl.show()
生成的准确率图:
