JMX
JMX(Java Management Extensions,即Java管理扩展)是一个为应用程序、设备、系统等植入管理功能的框架。JMX可以跨越一系列异构操作系统平台、系统体系结构和网络传输协议,灵活的开发无缝集成的系统、网络和服务管理应用。
通俗地讲,有了它就可以监控Java程序的基本信息和运行情况。
Kafka开启JMX的配置
Windows【修改kafka-server-start.bat文件,在设置堆内存后面加上JMX端口】
@echo off
rem Licensed to the Apache Software Foundation (ASF) under one or more
rem contributor license agreements.  See the NOTICE file distributed with
rem this work for additional information regarding copyright ownership.
rem The ASF licenses this file to You under the Apache License, Version 2.0
rem (the "License"); you may not use this file except in compliance with
rem the License.  You may obtain a copy of the License at
rem
rem     http://www.apache.org/licenses/LICENSE-2.0
rem
rem Unless required by applicable law or agreed to in writing, software
rem distributed under the License is distributed on an "AS IS" BASIS,
rem WITHOUT WARRANTIES OR CONDITIONS OF ANY KIND, either express or implied.
rem See the License for the specific language governing permissions and
rem limitations under the License.

IF [%1] EQU [] (
    echo USAGE: %0 server.properties
    EXIT /B 1
)

SetLocal
IF ["%KAFKA_LOG4J_OPTS%"] EQU [""] (
    set KAFKA_LOG4J_OPTS=-Dlog4j.configuration=file:%~dp0../../config/log4j.properties
)
IF ["%KAFKA_HEAP_OPTS%"] EQU [""] (
    rem detect OS architecture
    wmic os get osarchitecture | find /i "32-bit" >nul 2>&1
    IF NOT ERRORLEVEL 1 (
        rem 32-bit OS
        set KAFKA_HEAP_OPTS=-Xmx512M -Xms512M
    ) ELSE (
        rem 64-bit OS
        set KAFKA_HEAP_OPTS=-Xmx1G -Xms1G
    )
    set JMX_PORT="9999"
)
"%~dp0kafka-run-class.bat" kafka.Kafka %*
EndLocal
Linux【修改kafka-server-start.sh文件,在设置堆内存后配置JMX】
#!/bin/bash
# Licensed to the Apache Software Foundation (ASF) under one or more
# contributor license agreements.  See the NOTICE file distributed with
# this work for additional information regarding copyright ownership.
# The ASF licenses this file to You under the Apache License, Version 2.0
# (the "License"); you may not use this file except in compliance with
# the License.  You may obtain a copy of the License at
#
#    http://www.apache.org/licenses/LICENSE-2.0
#
# Unless required by applicable law or agreed to in writing, software
# distributed under the License is distributed on an "AS IS" BASIS,
# WITHOUT WARRANTIES OR CONDITIONS OF ANY KIND, either express or implied.
# See the License for the specific language governing permissions and
# limitations under the License.

if [ $# -lt 1 ];
then
    echo "USAGE: $0 [-daemon] server.properties [--override property=value]*"
    exit 1
fi
base_dir=$(dirname $0)

if [ "x$KAFKA_LOG4J_OPTS" = "x" ]; then
    export KAFKA_LOG4J_OPTS="-Dlog4j.configuration=file:$base_dir/../config/log4j.properties"
fi

if [ "x$KAFKA_HEAP_OPTS" = "x" ]; then
    export KAFKA_HEAP_OPTS="-Xmx1G -Xms1G"
    export JMX_PORT="9999"
fi

EXTRA_ARGS=${EXTRA_ARGS-'-name kafkaServer -loggc'}

COMMAND=$1
case $COMMAND in
  -daemon)
    EXTRA_ARGS="-daemon "$EXTRA_ARGS
    shift
    ;;
  *)
    ;;
esac

exec $base_dir/kafka-run-class.sh $EXTRA_ARGS kafka.Kafka "$@"
那么如何外部如何感知到Kafka的监控指标呢?
JConsole
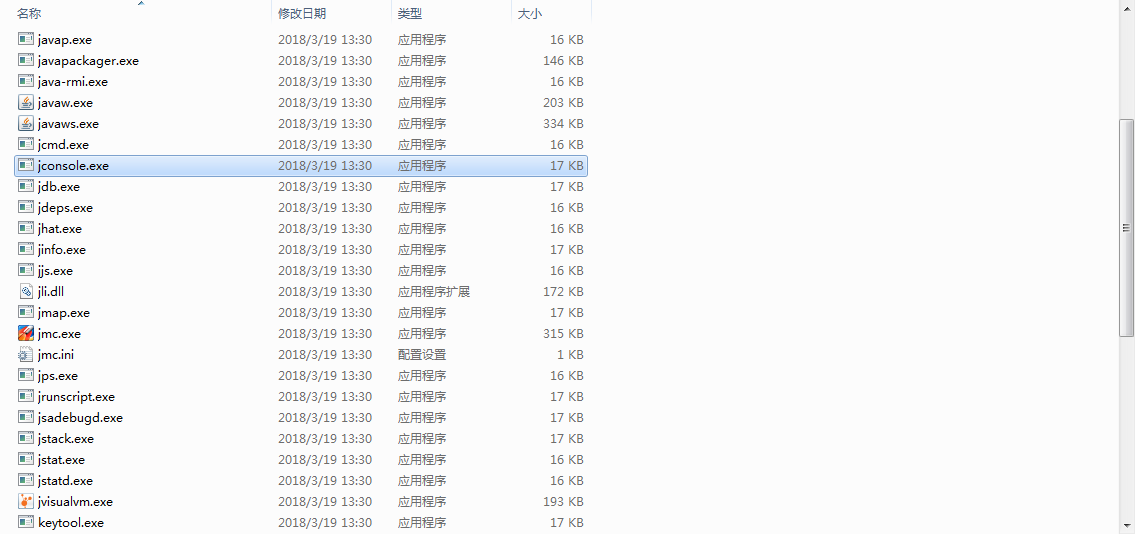
jconsole是JDK自带的监控工具,在JDK目录/bin下
打开,输入地址和JMX端口

首页:

一些概要

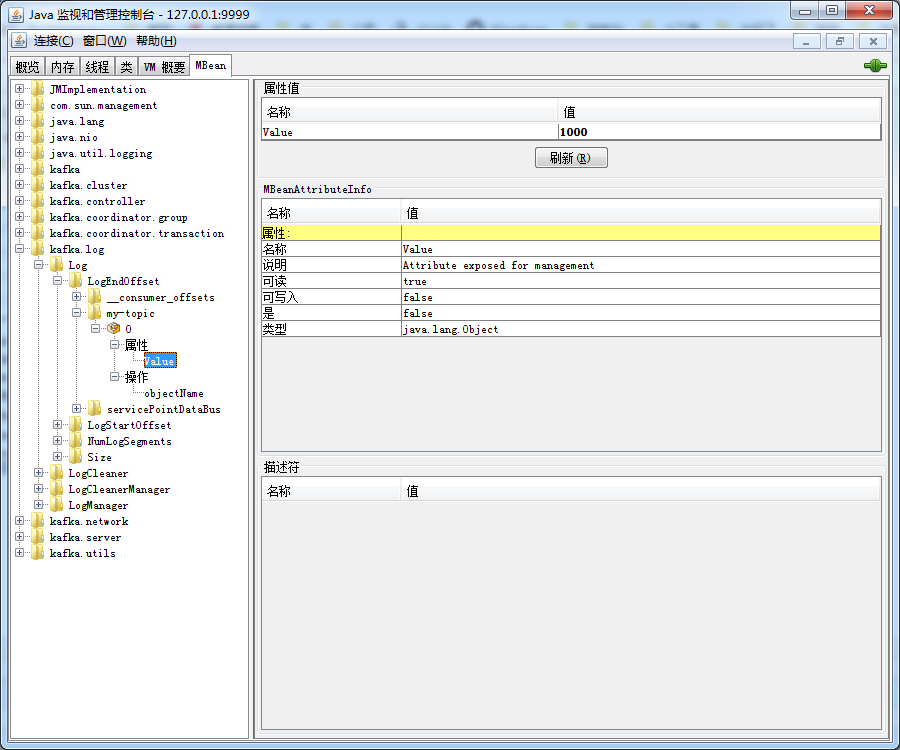
还有重要的MBean
Java连接JMX应用
以上面的Kafka信息为例
public static void jmx()throws Exception{
    JMXServiceURL url = new JMXServiceURL("service:jmx:rmi:///jndi/rmi://localhost:9999/jmxrmi");
    JMXConnector jmxc = JMXConnectorFactory.connect(url);
    MBeanServerConnection connection = jmxc.getMBeanServerConnection();

    System.out.println("=========Domains=========");
    String[] domains = connection.getDomains();
    for (String d : domains) {
        System.out.println(d);
    }

    System.out.println("=========MBeans=========");
    System.out.println(connection.getMBeanCount());


    System.out.println("=========Invoke=========");
    ObjectName mBeanName = new ObjectName("kafka.log:type=Log,name=Size,topic=my-topic,partition=0");
    // 获取值
    Object value = connection.getAttribute(mBeanName, "Value");
    System.out.println(value);
    // 执行MBean的方法
    Object invoke = connection.invoke(mBeanName, "objectName", null, null);
    System.out.println(invoke);


    System.out.println("=========MBean Info=========");
    mBeanName = new ObjectName("kafka.server:type=BrokerTopicMetrics,name=BytesInPerSec");
    MBeanInfo info = connection.getMBeanInfo(mBeanName);
    System.out.println("ClassName:"+info.getClassName());
    for(MBeanAttributeInfo attr : info.getAttributes()){
        System.out.println("属性:" + attr.getName() + ",类型:" + attr.getType() + ",值:" + connection.getAttribute(mBeanName, attr.getName()));

    }
    for(MBeanOperationInfo op : info.getOperations()){
        System.out.println("操作:" + op.getName());
    }

    jmxc.close();
}
输出:
=========Domains=========
java.util.logging
kafka.utils
kafka.controller
java.nio
kafka.network
JMImplementation
kafka.log
kafka.coordinator.group
java.lang
com.sun.management
kafka.server
kafka.cluster
kafka
kafka.coordinator.transaction
=========MBeans=========
1098
=========Invoke=========
24997
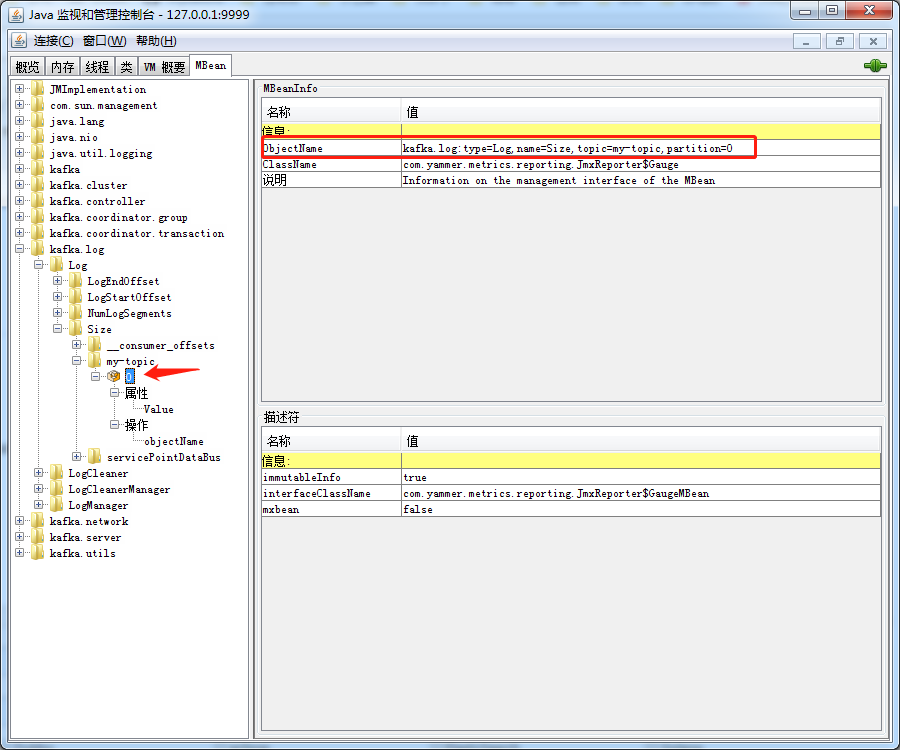
kafka.log:type=Log,name=Size,topic=my-topic,partition=0
=========MBean Info=========
ClassName:com.yammer.metrics.reporting.JmxReporter$Meter
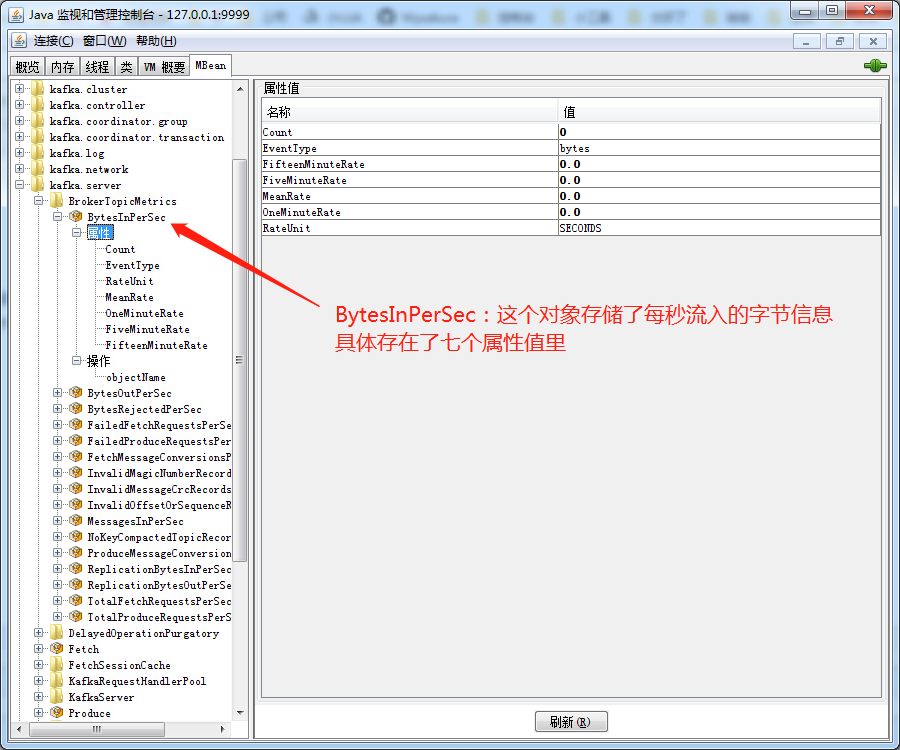
属性:Count,类型:long,值:0
属性:EventType,类型:java.lang.String,值:bytes
属性:RateUnit,类型:java.util.concurrent.TimeUnit,值:SECONDS
属性:MeanRate,类型:double,值:0.0
属性:OneMinuteRate,类型:double,值:0.0
属性:FiveMinuteRate,类型:double,值:0.0
属性:FifteenMinuteRate,类型:double,值:0.0
操作:objectName
解释:
1. 输出了当前所有的Domain信息。
2. 还能输出MBean的总数量。
3. 输出监控信息才是我们真正需要的:ObjectName其中的值对应在JConsole
4. 每一个具体的Object下面都有两个信息:属性和操作(方法),很容易理解吧
更多的方法自行探索