 1 import numpy as np
 2 from sklearn.manifold import TSNE
 3 import matplotlib.pyplot as plt
 4 from mpl_toolkits.mplot3d import Axes3D
 5
 6
 7 def read(path: str) -> list:
 8     with open(path, "r") as f:
 9         text = f.readlines()
10         D = []
11         for row in text:
12             row = str.replace(row, "14:", ",")
13             row = str.replace(row, "13:", ",")
14             row = str.replace(row, "12:", ",")
15             row = str.replace(row, "11:", ",")
16             row = str.replace(row, "10:", ",")
17             row = str.replace(row, "9:", ",")
18             row = str.replace(row, "8:", ",")
19             row = str.replace(row, "7:", ",")
20             row = str.replace(row, "6:", ",")
21             row = str.replace(row, "5:", ",")
22             row = str.replace(row, "4:", ",")
23             row = str.replace(row, "3:", ",")
24             row = str.replace(row, "2:", ",")
25             row = str.replace(row, "1:", ",")
26             row = str.replace(row, ",-1 1,", ",")
27             row = str.replace(row, ",1 1,", ",")
28             substr = str.split(str.split(row, "
")[0], ",")
29             X = []
30             for a in substr:
31                 X.append(float(a))
32             D.append(X)
33     return D
34
35
36 def init(D: list) -> tuple:
37     n, m = len(D), len(D[0])
38     X, Y = [], []
39     for i in range(n):
40         x = []
41         if len(D[i]) != m:
42             n -= 1
43             continue
44         for j in range(1, m, 1):
45             x.append(D[i][j])
46         X.append(x)
47         Y.append(D[i][0])
48     # print(n, m)
49     return X, Y, n, m - 1
50
51
52 if __name__ == '__main__':
53
54     D = read("binary_data.txt")
55     X, Y, n, m = init(D)
56
57     x = np.array(X)
58
59     tsne = TSNE(n_components=3)
60
61     tsne.fit_transform(x)
62
63     one_x, one_y, one_z, zero_x, zero_y, zero_z = [], [], [], [], [], []
64     for i in range(n):
65         _x, _y, _z = tsne.embedding_[i][0], tsne.embedding_[i][1], tsne.embedding_[i][2]
66         if Y[i] > 0:
67             zero_x.append(_x)
68             zero_y.append(_y)
69             zero_z.append(_z)
70         else:
71             one_x.append(_x)
72             one_y.append(_y)
73             one_z.append(_z)
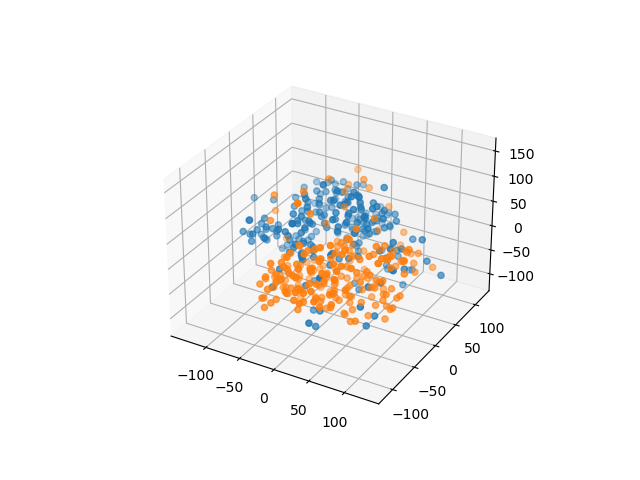
74     '''
75     ax = plt.axes(projection='3d')
76     ax.scatter3D(one_x, one_y, one_z)
77     ax.scatter3D(zero_x, zero_y, zero_z)
78     '''
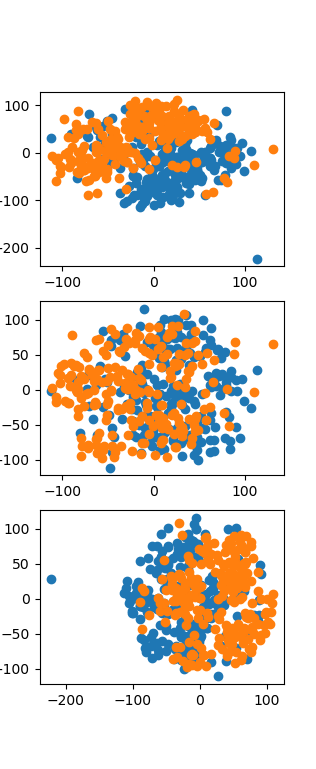
79     plt.subplot(311)
80     plt.scatter(one_x, one_y)
81     plt.scatter(zero_x, zero_y)
82     plt.subplot(312)
83     plt.scatter(one_x, one_z)
84     plt.scatter(zero_x, zero_z)
85     plt.subplot(313)
86     plt.scatter(one_y, one_z)
87     plt.scatter(zero_y, zero_z)
88     plt.show()

