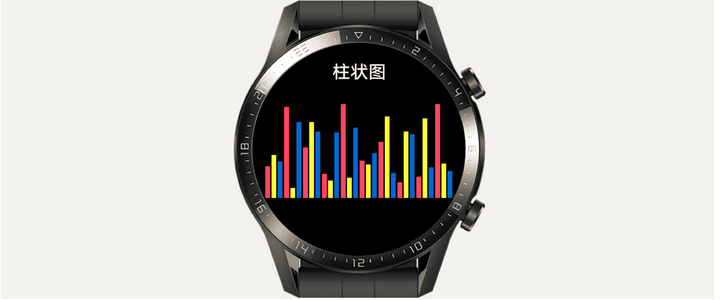
一、运行效果
在页面中分别使用红色、黄色和蓝色显示三组柱状图,如下图所示:

二、实现思路
通过将组件chart的属性type设置为"bar"来绘制一张柱状图。在组件chart中,通过动态绑定的方式指定属性options和datasets的值,以对图形的参数进行设置。
三、代码详解
打开文件index.hml。
将组件text中显示的页面标题修改为:柱状图。
在页面标题的下方添加一个组件chart。在组件chart中,通过动态绑定的方式将属性options和datasets的值分别设置为"{{options}}"和"{{datasets}}"。将属性type的值设置为"{{bar}}",以显示一张柱状图。
代码如下所示:
<div class="container">
    <text class="title">
        柱状图
    </text>
    <chart class="chart" type="bar" options="{{options}}" datasets="{{datasets}}">
    </chart>
</div>
打开文件index.css。
分别定义三个类选择器,以定义index.hml中组件div、text和chart的样式。
代码如下所示:
.container {
     454px;
    height: 454px;
    flex-direction: column;
    justify-content: flex-start;
    align-items: center;
}
.title {
     240px;
    height: 90px;
    margin-top: 40px;
    font-size: 38px;
    text-align: center;
}
.chart {
     400px;
    height: 200px;
}
作者:张荣超
想了解更多内容,请访问: 51CTO和华为官方战略合作共建的鸿蒙技术社区https://harmonyos.51cto.com/