参考链接:https://blog.csdn.net/theonegis/article/details/51037850
补充:
若是有多个操作对象,animate里不返回也是可以的;
#缩进没有严格
def animate(fi):
        # bars=[]
        for i in range(algorithm_num):
            if len(frames_names[algorithm_list[i].__name__])>fi:

                for rect,yi in zip(frames_names['bar%s'%algorithm_list[i].__name__],frames_names[algorithm_list[i].__name__][fi]):
                    rect.set_height(yi.value)
                    rect.set_color(yi.color)
    anim=animation.FuncAnimation(fig,animate,frames=max(list(map(int,list(frame_count.values())) )),interval=frame_interval,repeat=True)
官方文档:https://matplotlib.org/3.1.0/api/_as_gen/matplotlib.animation.FuncAnimation.html
我们可以使用Matplotlib的animation类的FuncAnimation()方法来制作动画,只需要提供一个动态更新数据的函数
需要注意的是,这个函数需要以元组的形式返回一个需要在下一次绘图中更新的数据
一个拥有详细解释的实例的链接:http://codingpy.com/article/drawing-gifs-with-matplotlib
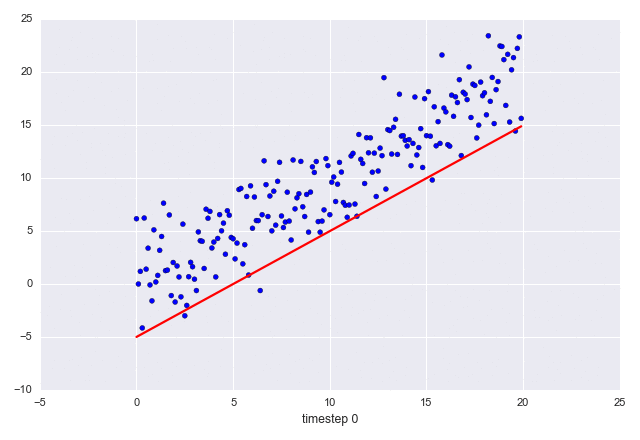
有两点需要注意
- 图里的散点部分是不变的;变的是直线
- X 轴的标题每一帧都在变化
import numpy as np
import matplotlib as plt
from matplotlib import animation

plt.fig,ax=plt.subplots()
plt.fig.set_tight_layout(True)#tight:紧的;layout:布局
    #DPI:每英寸的点数
    #获取图片的分辨率和尺寸
    #在保存图片时,还需要另外指明图片的DPI
print('图片的分辨率尺寸是{0}DPI,size in inches is {1}'.format(plt.fig.get_dpi(),plt.fig.get_size_inches()))#inches:英寸

    #画出一个维持不变的散点图和一开始的那条直线
    #困难的问题从约定俗成的方法去解决,不如先不管多么复杂的图像,第一步就是创建点的集合
X=np.arange(0,20,0.1)
ax.scatter(X,X+np.random.normal(0,3.0,len(X)))#这种方法很好啊
line,=plt.plot(X,X-0.5,'r-',linewidth=2)
plt.title('Interesting Graph',fontsize='large',fontweight='bold',verticalalignment='center')#设置标题位置不起作用
def update(i):
    label='timestep{0}'.format(i)
    print(label)
    #更新直线和X轴,使用一个新的X轴的标签
    #以元组的形式返回在这一帧需要被更新的物体
    line.set_ydata(X-5+i)
    ax.set_label(label)
    return ax,line

if __name__=='__main__':
    #FuncAnimation会在每一帧都调用update函数
    #在这里设置一个10帧的动画,每帧之间间隔200ms
    anim=animation.FuncAnimation(plt.fig,update,frames=np.arange(0,10),interval=200)#frame:帧
    #我知道问什么这里提示figundefine了,因为前面的fig在函数中声明的
    plt.show()
FuncAnimation方法的一些参数:
fig:对象
update:以元组形式返回这一帧需要被重新绘图物体的一个函数
frames:帧数
interval:每帧之间的间隔,以毫秒为单位
保存
如果你想用matplotlib的save方法渲染GIF图的话,就必须安装ImageMagick
ageMagick是一个免费的创建、编辑、合成图片的软件。它可以读取、转换、写入多种格式的图片
anim.save('line.gif', dpi=80, writer='imagemagick')
其他的:
记得要掌握一些知识点约定俗称的步骤,如使用matplotlib画图,无论多么复杂,第一步都是构造点的集合np.arange或者random.normal(),或者曲线np.linspace(),尤其是面对新的问题,这样做就显得特别重要
问题:
1)无法显示title
2)导入seaborn包没有用(已解决)
import seaborn as sns
sns.set_style('whitegrid')