1. 环境准备
两台ubuntu 16.04
| 服务器内网IP | 作用 | 安装软件 |
| 172.16.4.11 | 监控的服务端 | Prometheus(服务端软件) Grafana(数据展示) |
| 172.16.4.12 | 被监控的客户端 |
node_exporter(收集服务器数据) mysqld_exporter(收集mysql数据) |
2. 客户端安装 node_exporter
node_exporter 主要用于获取CPU,内存,IO,网络,硬盘等基础数据
下载安装node_exporter
#下载解压node_exporter

wget https://github.com/prometheus/node_exporter/releases/download/v0.17.0/node_exporter-0.17.0.linux-amd64.tar.gz

tar zxvf  node_exporter-0.17.0.linux-amd64.tar.gz

mv  node_exporter-0.17.0.linux-amd64 /opt/node_exporter
启动node_exporter
   cd /opt/node_exporter

   nohup ./node_exporter &
查看启动端口
tail -f 10 nohup.out
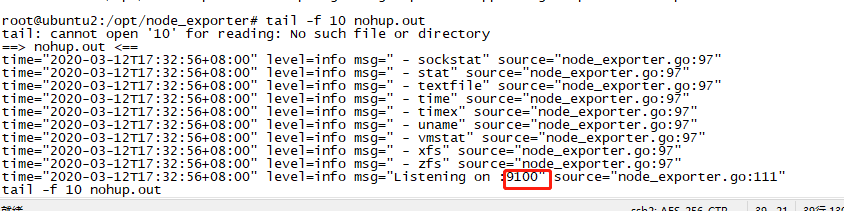
设置允许端口访问 sudo ufw allow 9100
可以在内网通过 http://172.16.4.12:9100/metrics 查看客户端数据
3. 客户端安装 mysqld_exporter
mysqld_exporter 主要监控Mysql数据库的稳定性、吞吐量、连接情况、缓冲池使用情况、查询性能等各项指标
下载安装mysqld_exporter
#下载解压mysqld_exporter

wget https://github.com/prometheus/mysqld_exporter/releases/download/v0.11.0/mysqld_exporter-0.11.0.linux-amd64.tar.gz

tar zxvf  mysqld_exporter-0.11.0.linux-amd64.tar.gz

mv  mysqld_exporter-0.11.0.linux-amd64 /opt/mysqld_exporter
配置数据库连接
创建监控用的mysql用户
mysql -u root -p
输入root账号密码后,创建用户
create user 'mysql_monitor'@'%' identified by 'monitor123456';

grant replication client, process on *.* to mysql_monitor@"%" identified by "monitor123456";

grant select on performance_schema.* to mysql_monitor@"localhost";
进入mysqld_exporter安装目录创建.my.cnf配置文件
cd /opt/mysqld_exporter
vim .my.cnf
添加如下配置
[client]
user=mysql_monitor
password=monitor123456
启动 mysqld_exporter
nohup ./mysqld_exporter --config.my-cnf=.my.cnf &
查看启动端口
tail -f nohup.out
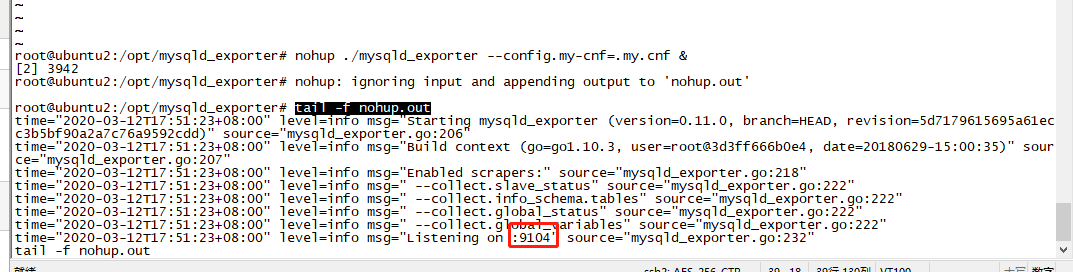
设置允许端口访问 sudo ufw allow 9104
可以在内网通过 http://172.16.4.12:9104/metrics 查看mysql的相关监控数据
4. 服务端安装 Prometheus
安装 Prometheus
sudo wget https://github.com/prometheus/prometheus/releases/download/v2.8.1/prometheus-2.8.1.linux-amd64.tar.gz
tar zxvf prometheus-2.8.1.linux-amd64.tar.gz
mv prometheus-2.8.1.linux-amd64 /opt/prometheus
配置 Prometheus
cd /opt/prometheus

vi prometheus.yml
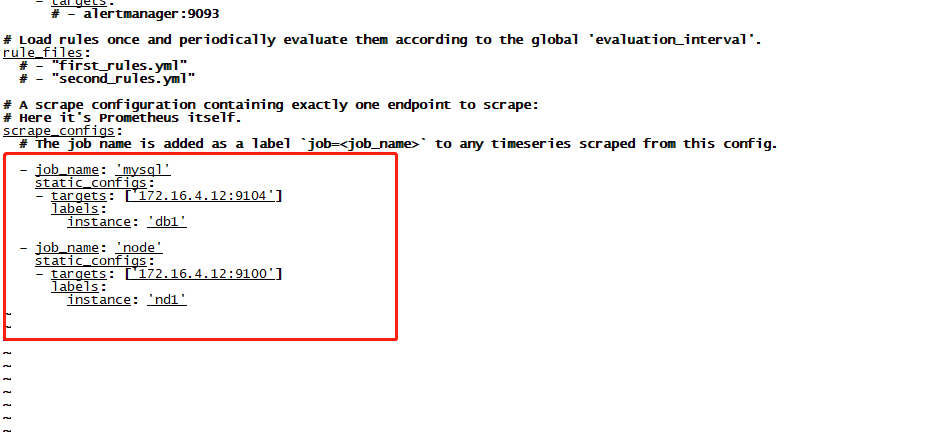
在 配置文件中增加对客户端的节点和数据库的监控配置
- job_name: 'mysql'
static_configs:
- targets: ['172.16.4.12:9104']
labels:
instance: 'db1'
- job_name: 'node'
static_configs:
- targets: ['172.16.4.12:9100']
labels:
instance: 'nd1'
截图如下
启动 Prometheus
nohup ./prometheus --config.file=./prometheus.yml &
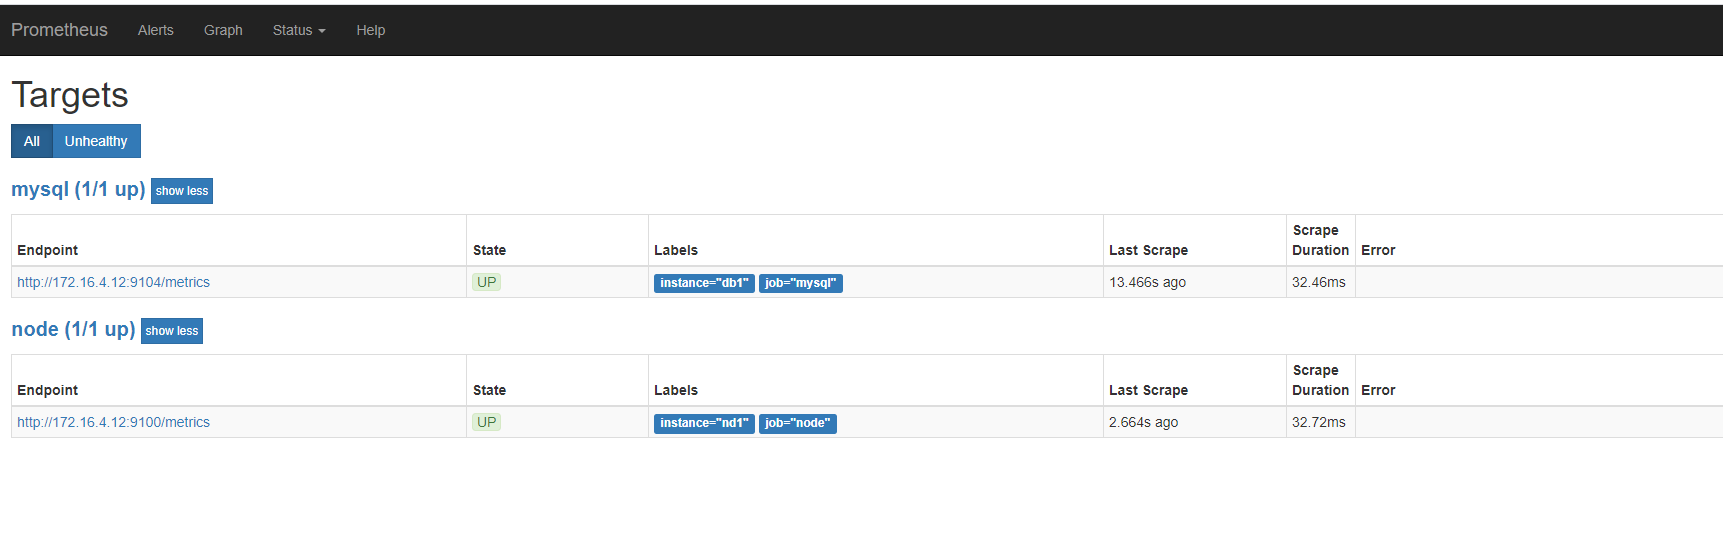
访问:http://172.16.4.11:9090/ 即可打开Prometheus 网页
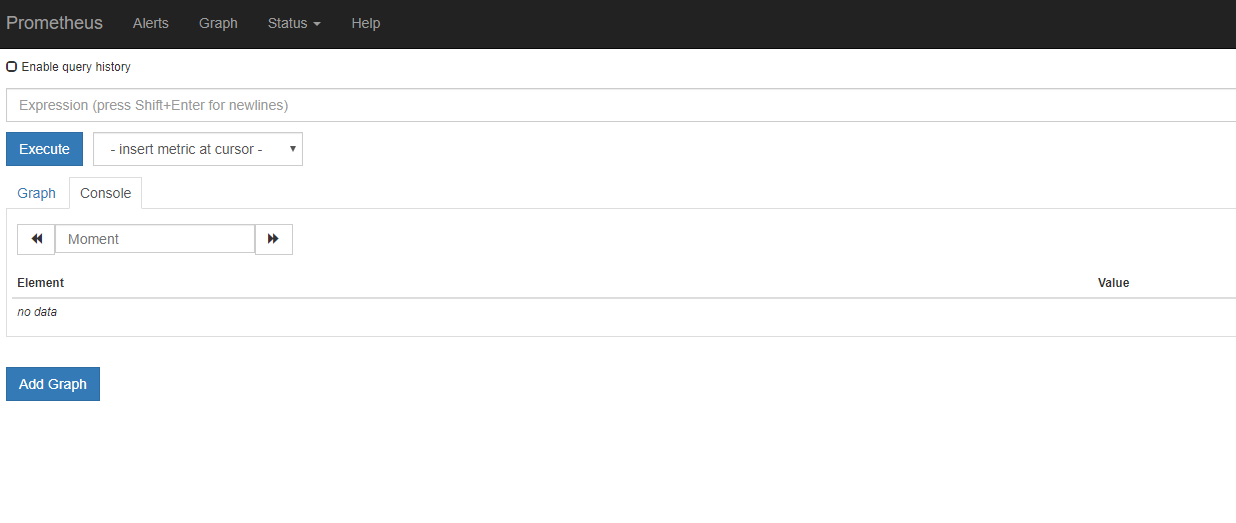
点击 Status --》 Target 即可看到我们的node和mysql的监控数据
5. 安装可视化数据展示Grafana
下载Grafana
sudo apt-get -y install wget

wget https://dl.grafana.com/oss/release/grafana_6.0.0-beta1_amd64.deb
sudo apt-get -f install
sudo dpkg -i grafana_6.0.0-beta1_amd64.deb
运行Grafana
systemctl start grafana-server

设置为开机启动

sudo systemctl enable grafana-server
打开3000端口
sudo ufw allow 3000
启动后可以通过 http://172.16.4.11:3000/ 访问

登录设置
初始密码 admin/admin ,
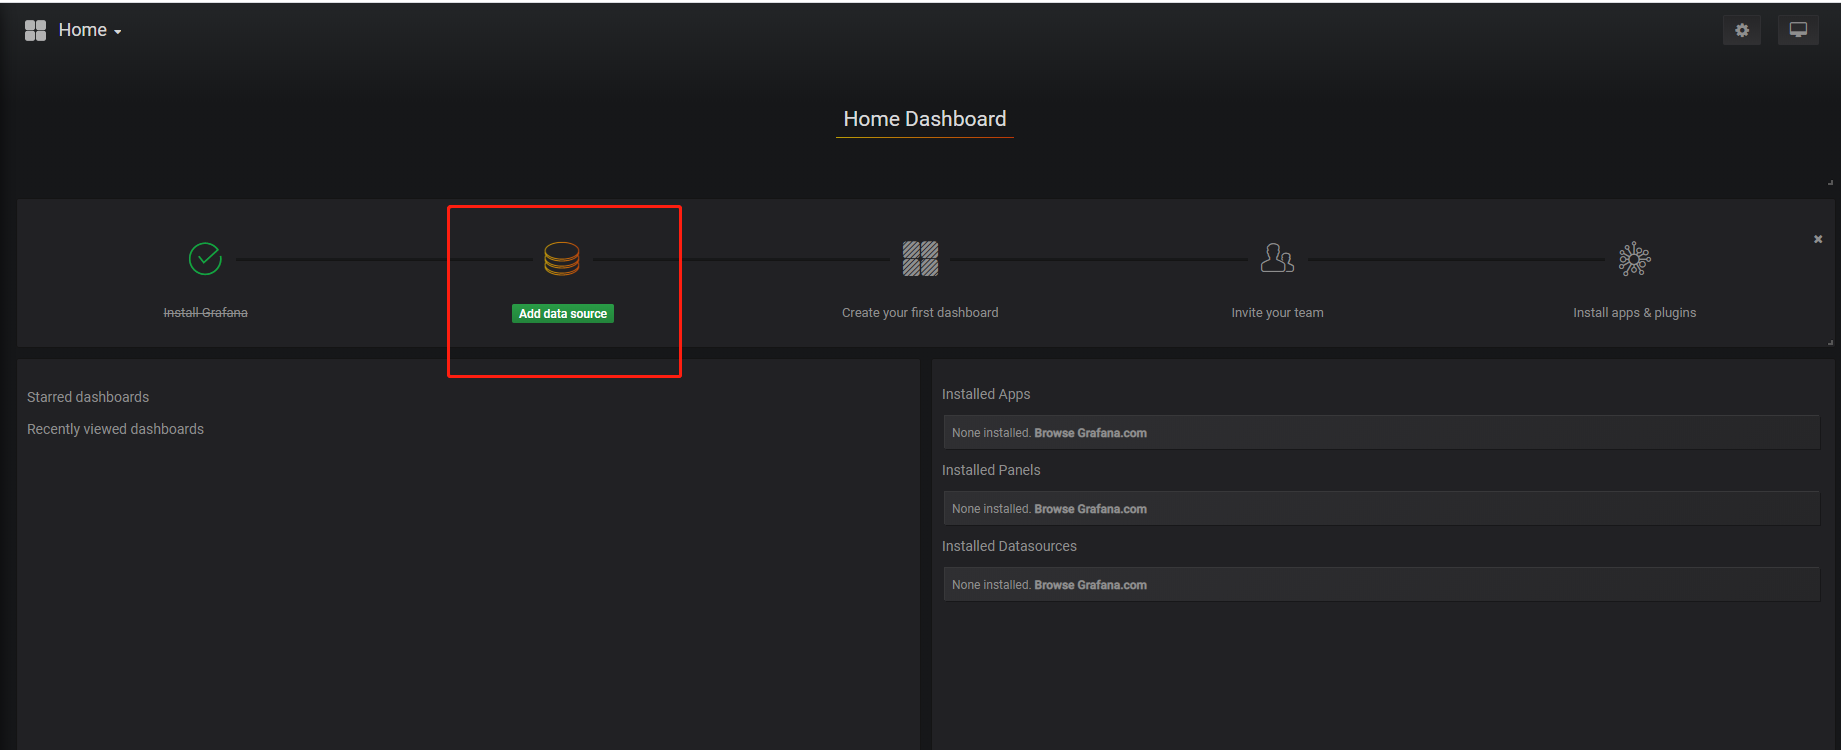
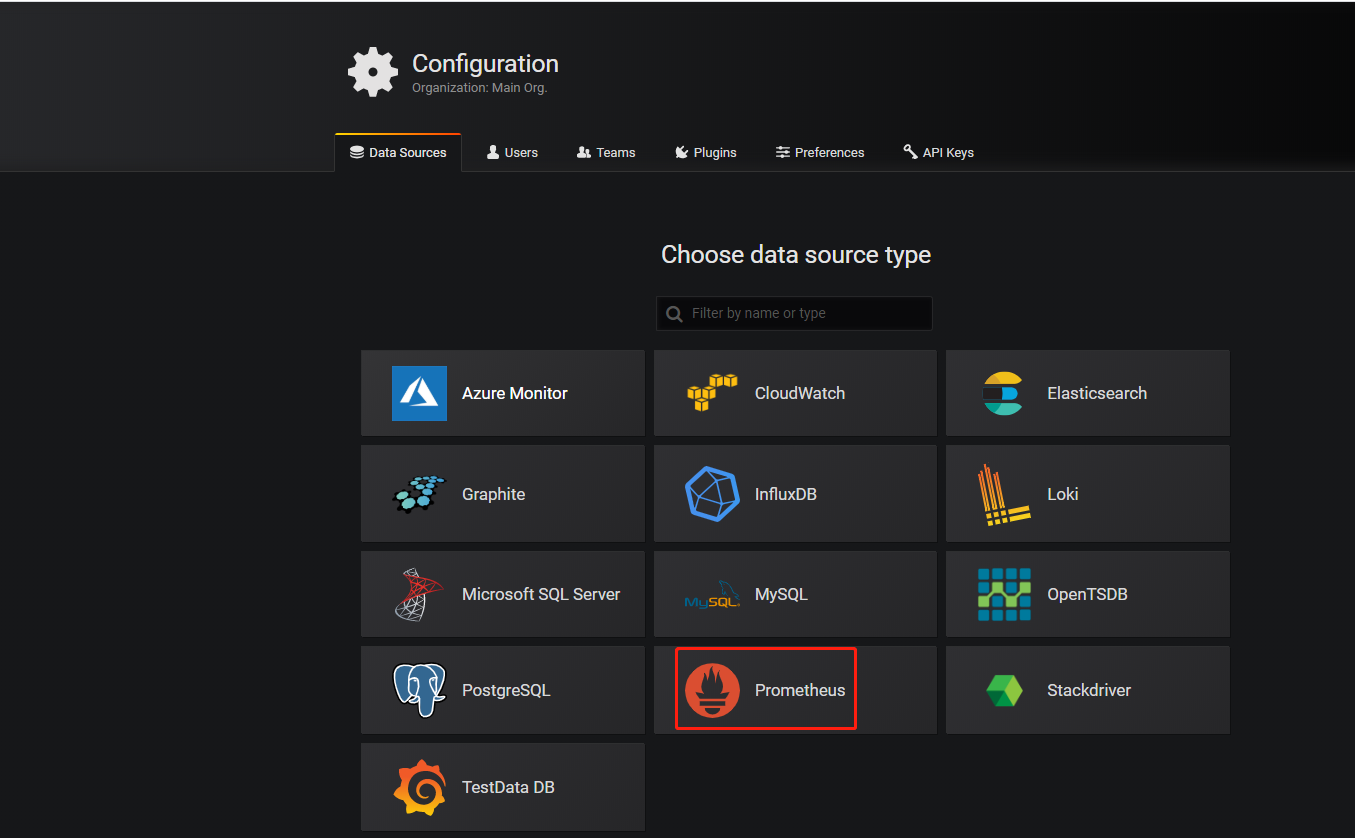
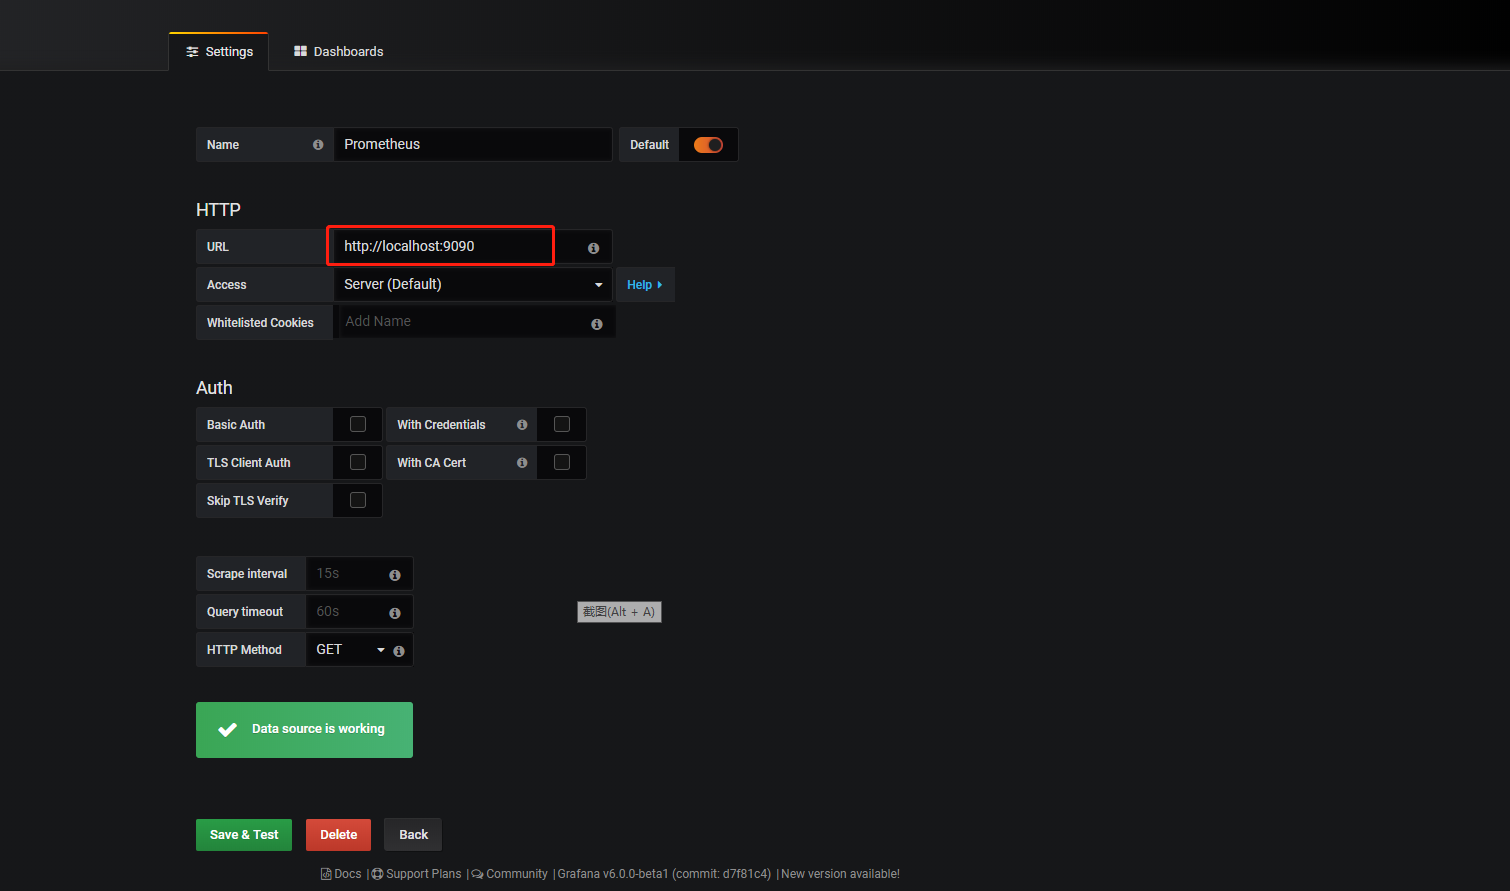
1. 添加一个data source ,使Grafana从Prometheus读取数据
2. 导入对node监控的DashBoard
首先去网站 https://grafana.com/grafana/dashboards 下载对主机监控的Dashboard
搜素 Node Exporter

点开第一个 ,拷贝对应的Dashboard Id 8919
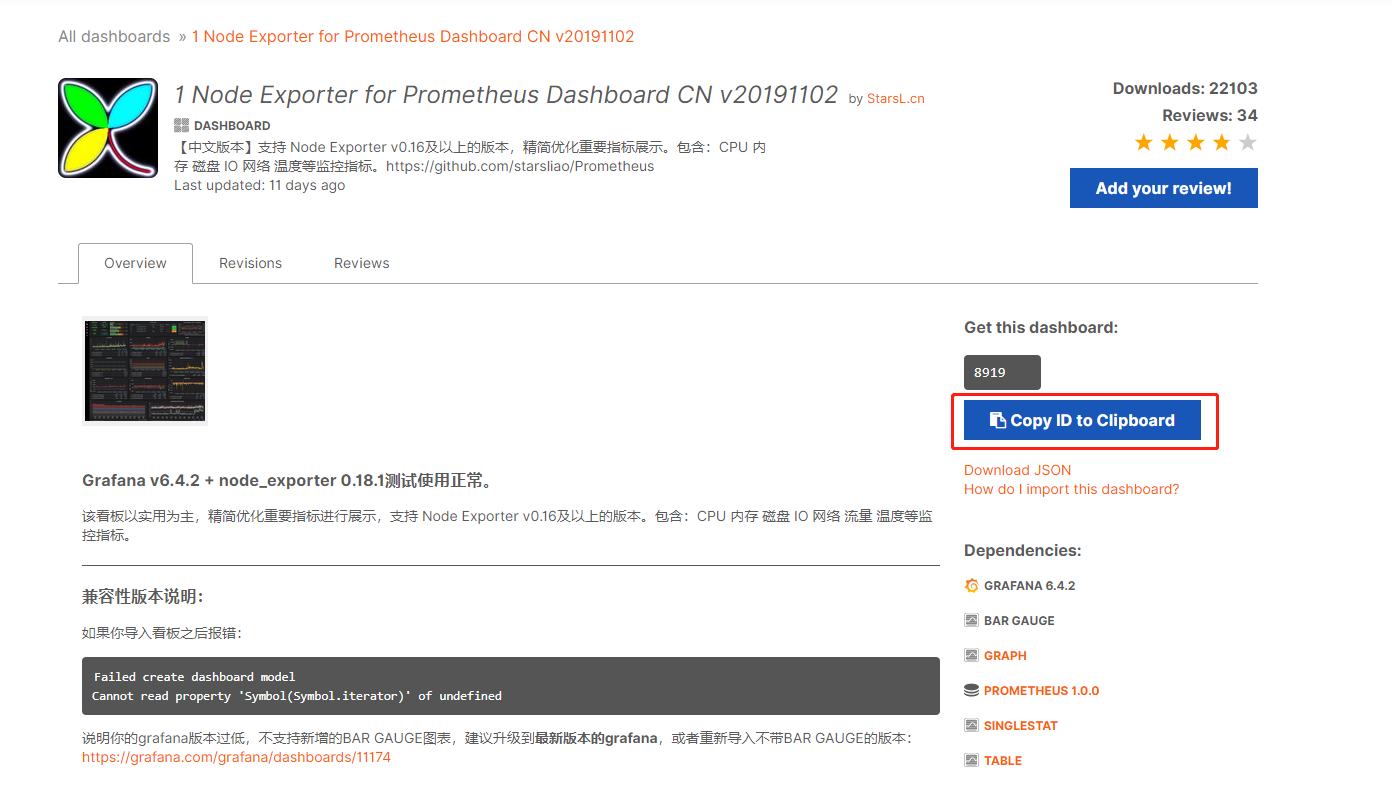
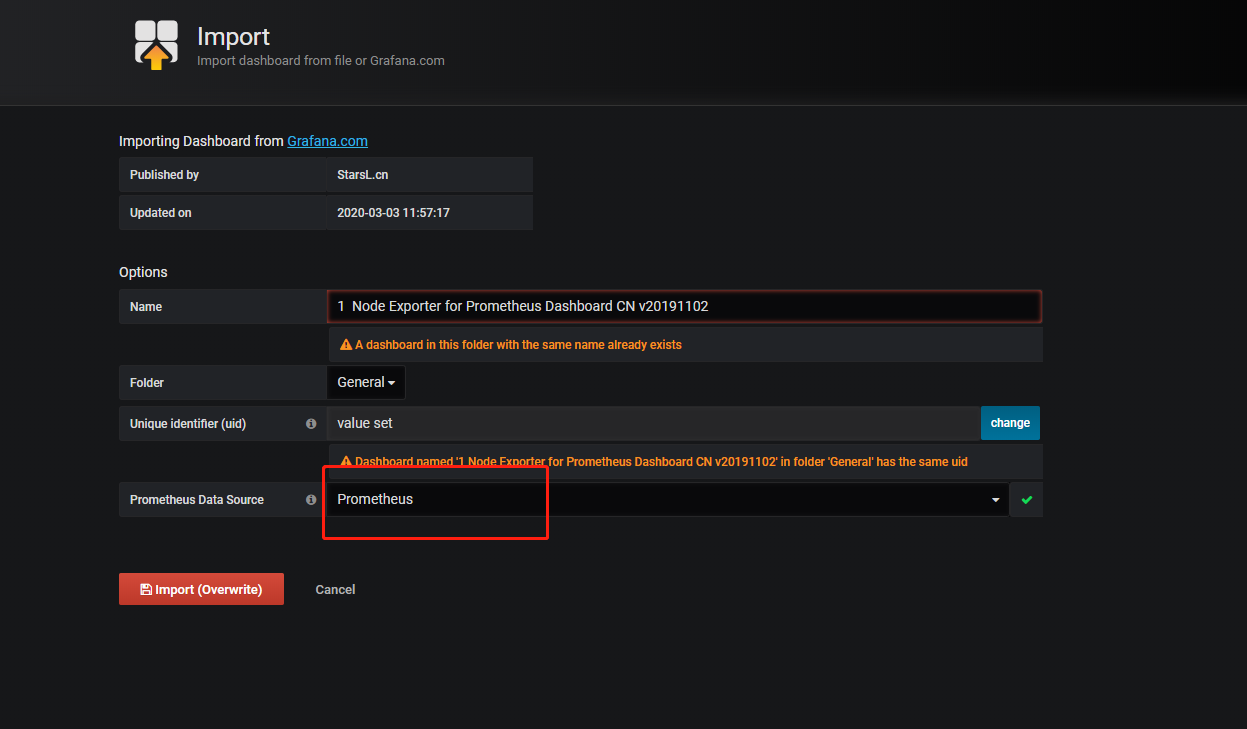
回到我们的图形监控平台Grafana,Dashboard ---> import
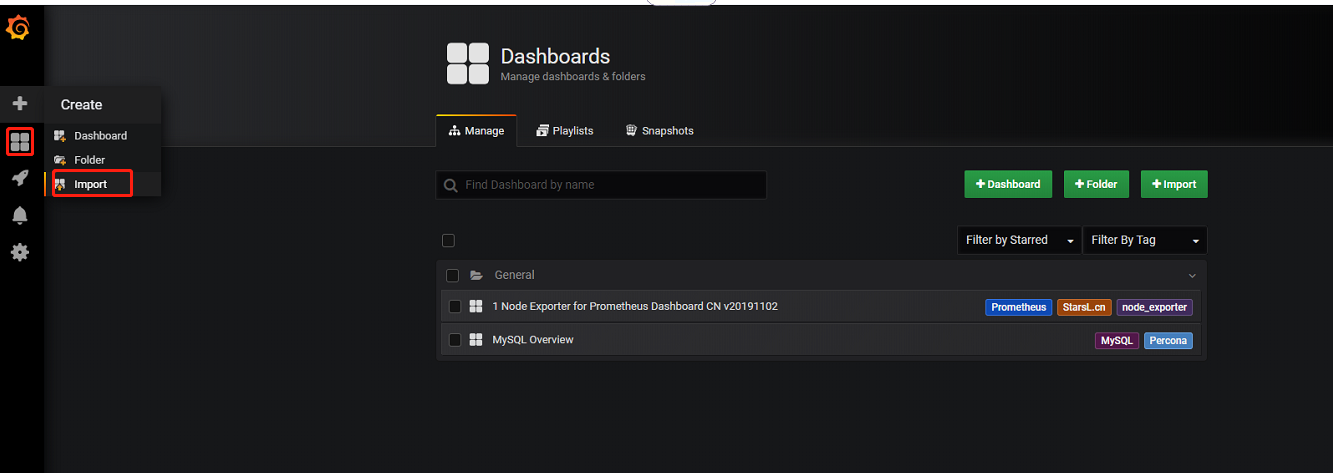
输入 dashboard ID 8919,选择数据源为prometheus即可
3. 导入 mysql对应的监控面板
同上面的node监控面板一样,搜索关键字 mysql overview .找到对应的dashboard id 7362
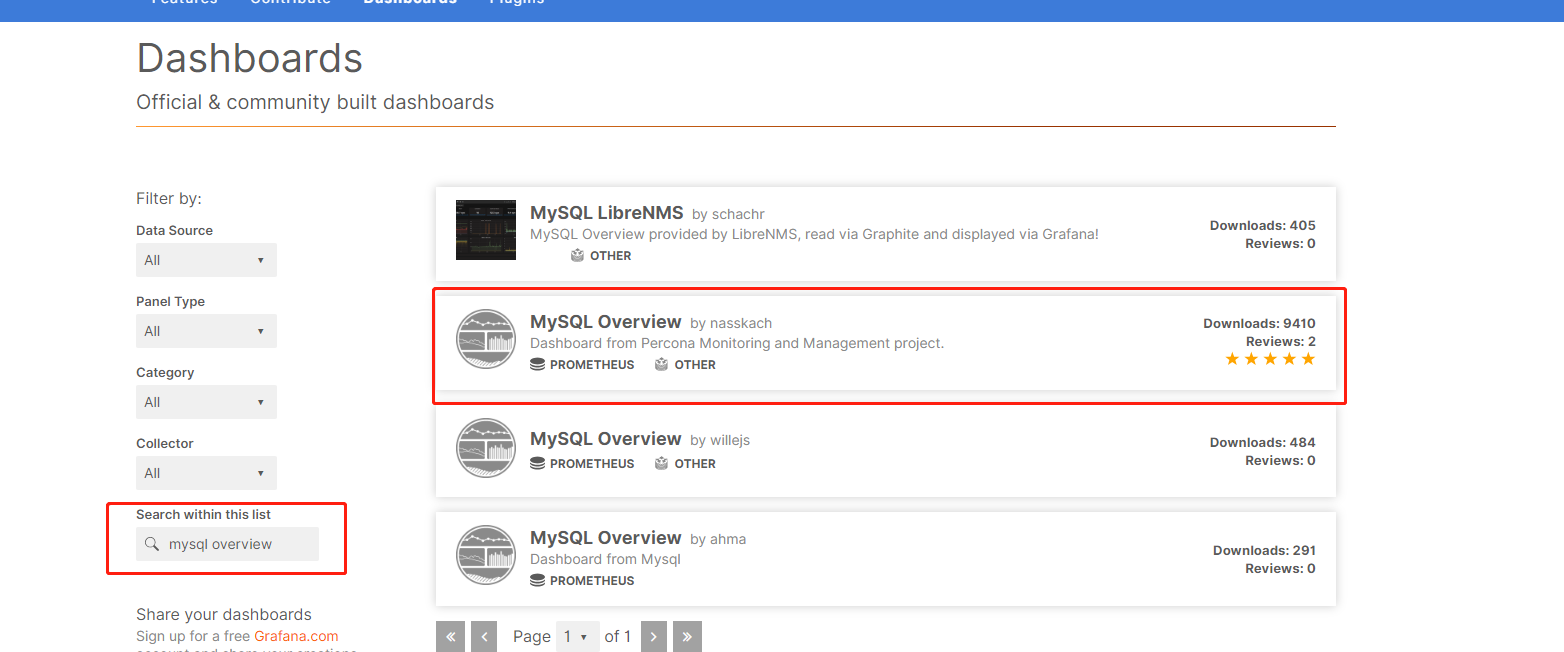
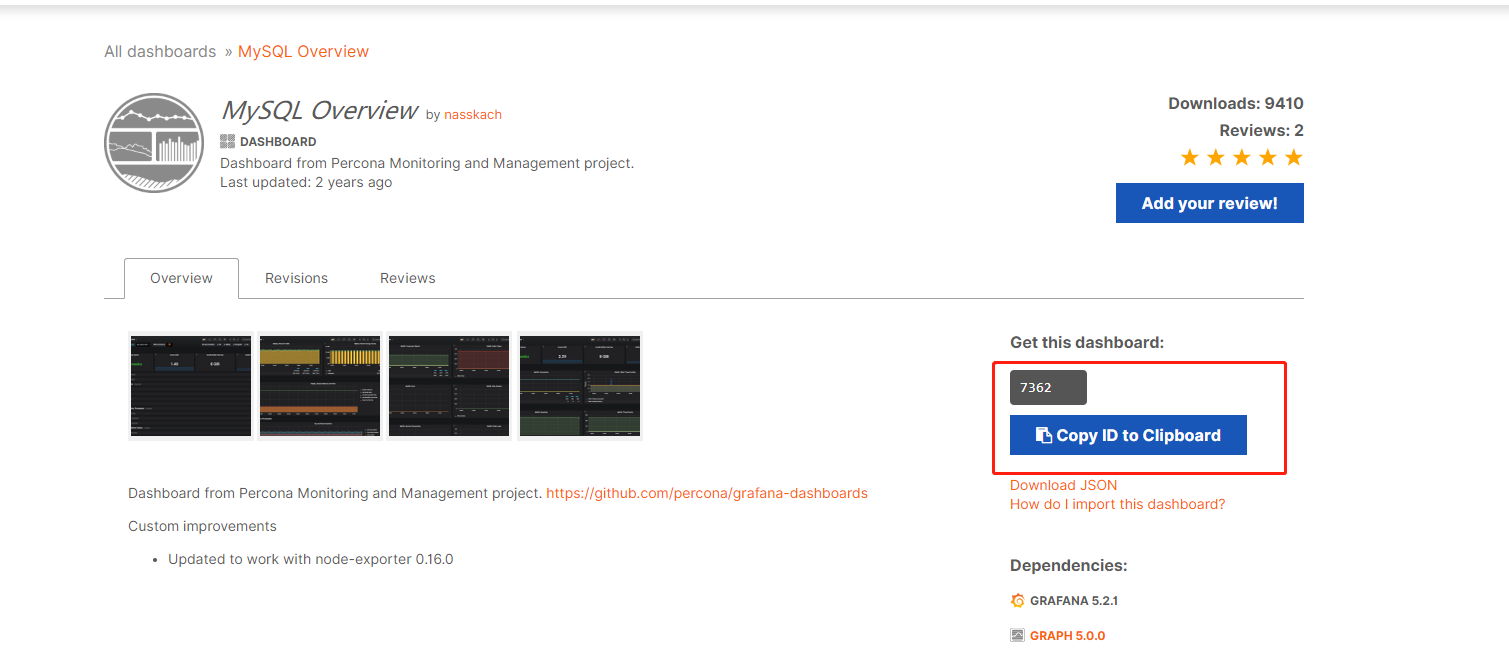
然后同上 添加Dashboard ---》 import 导入该面板
到目前为止node和mysql的面板都导入成功
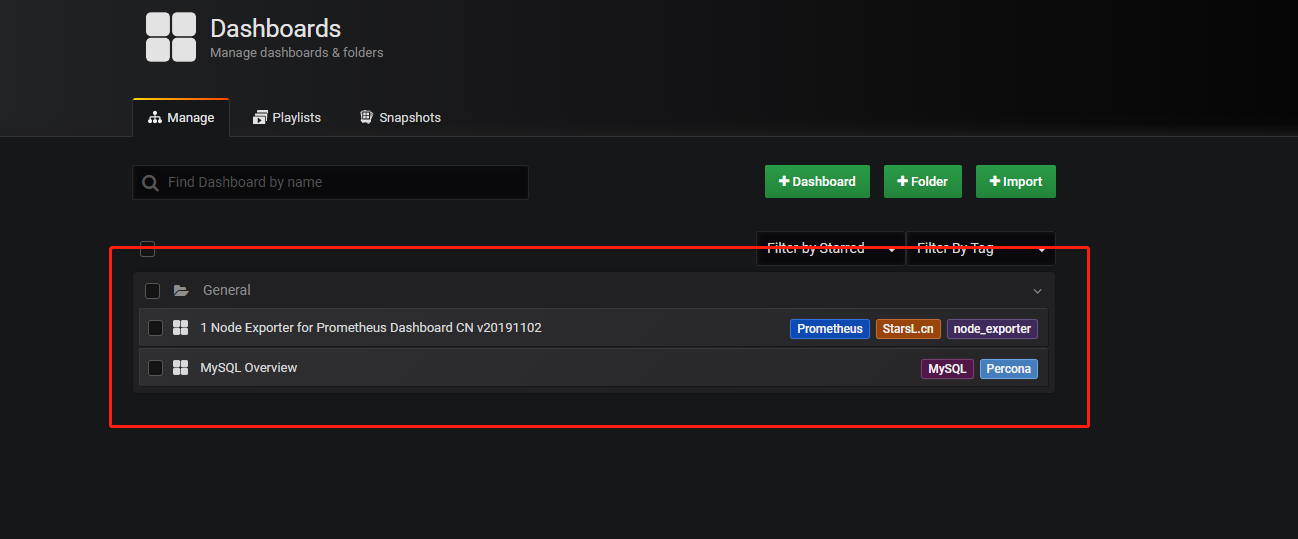
4. 点击具体的面板即可查看具体的面板信息
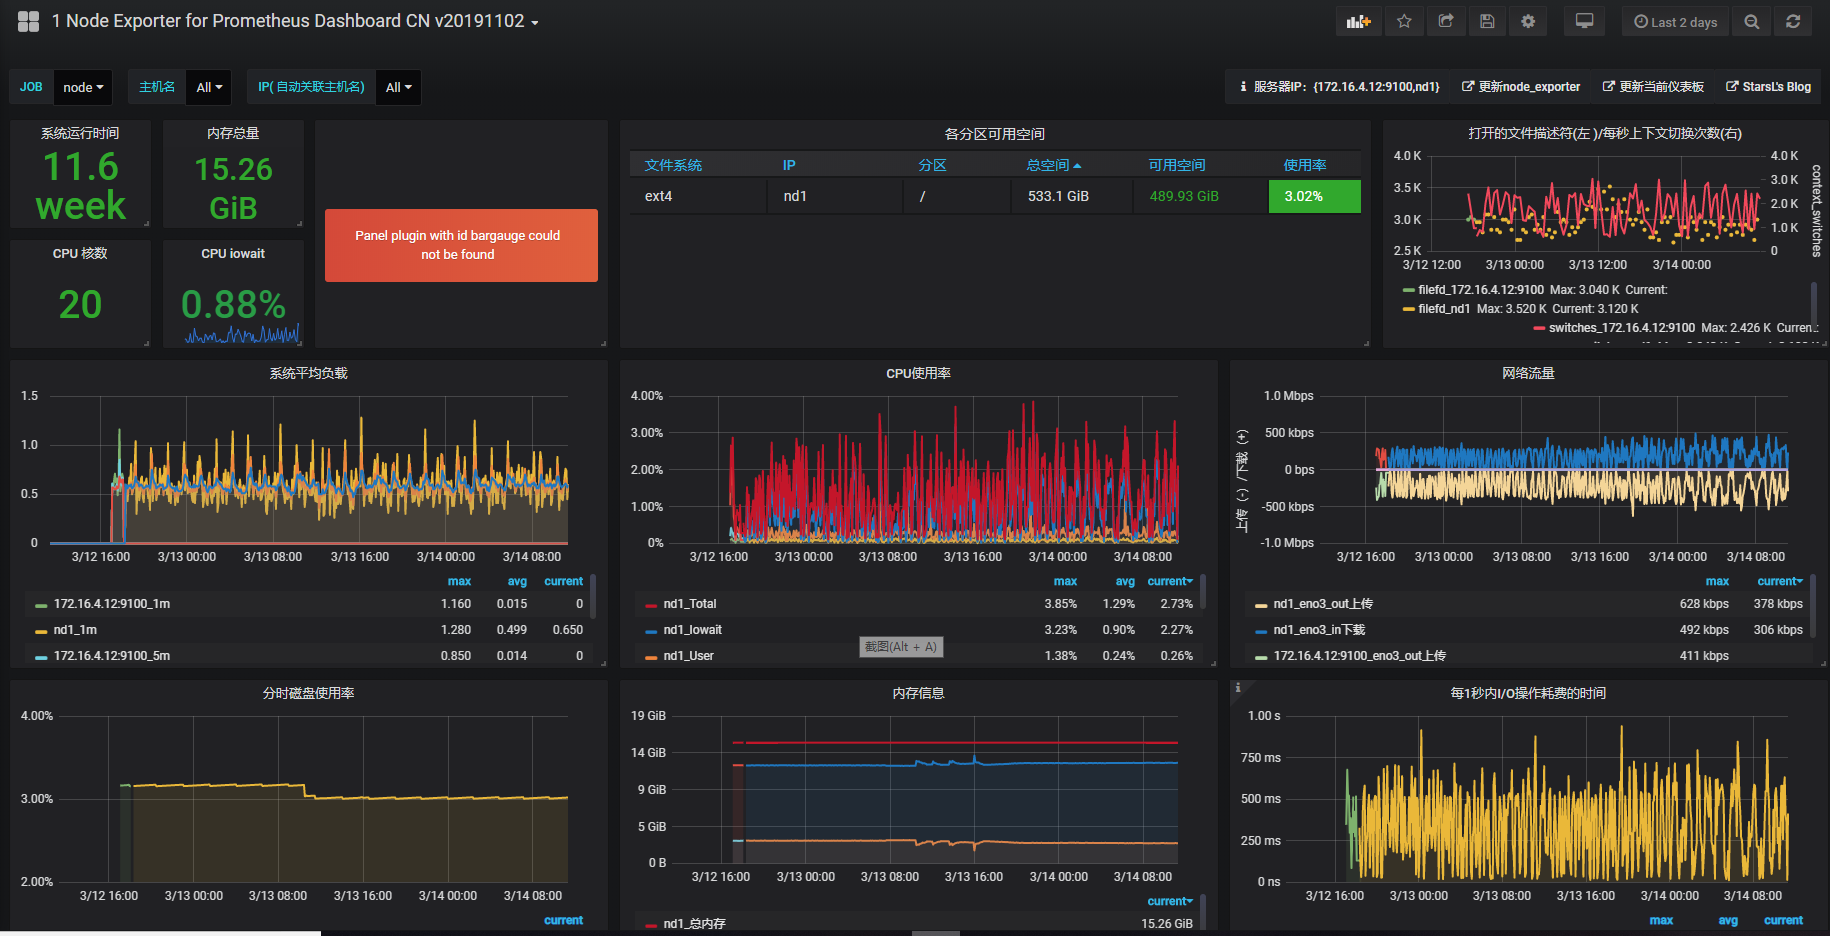
4.1 node面板
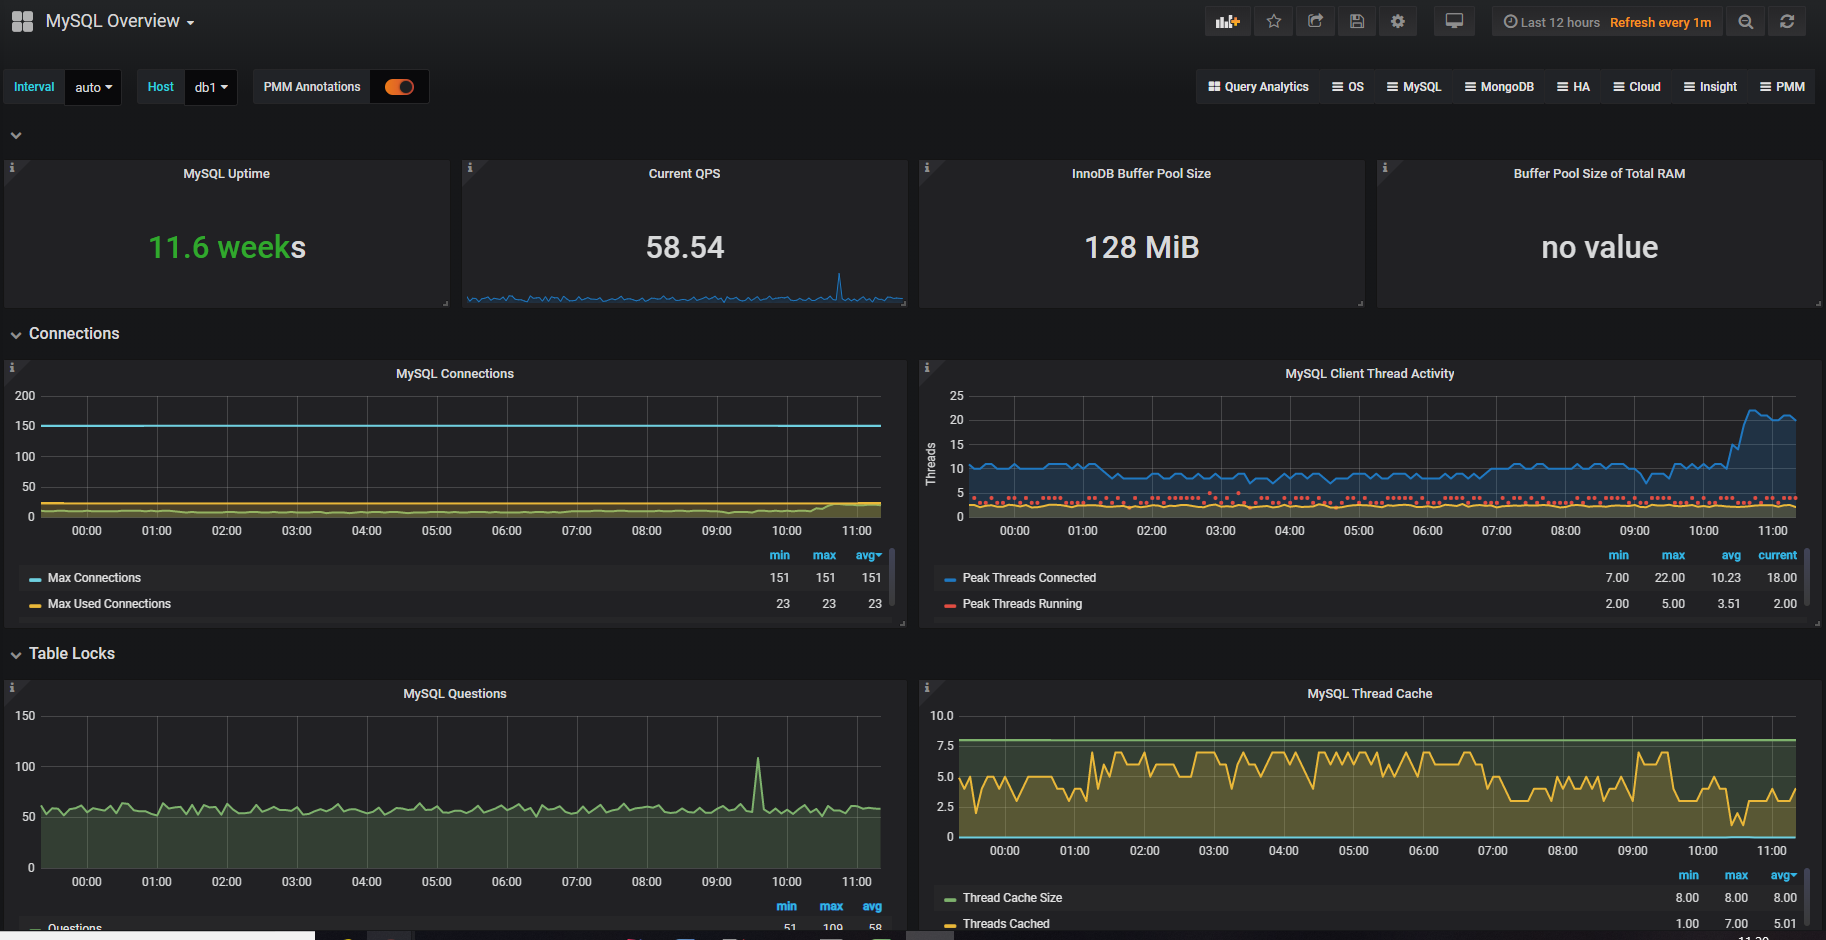
4.2 mysql面板
5. 插件安装
上面的node面板,有个图片显示不全需要安装插件
# 列出所有的可用插件

grafana-cli plugins list-remote

#安装我们需要的插件

grafana-cli plugins install bargauge

#插件安装后重启grafana

systemctl restart grafana-server
至此,对node和mysql的监控平台搭建完成,后续也可以配置一些alert,当符合一定条件时可以邮件或者钉钉通知告警