k8s日志收集方案
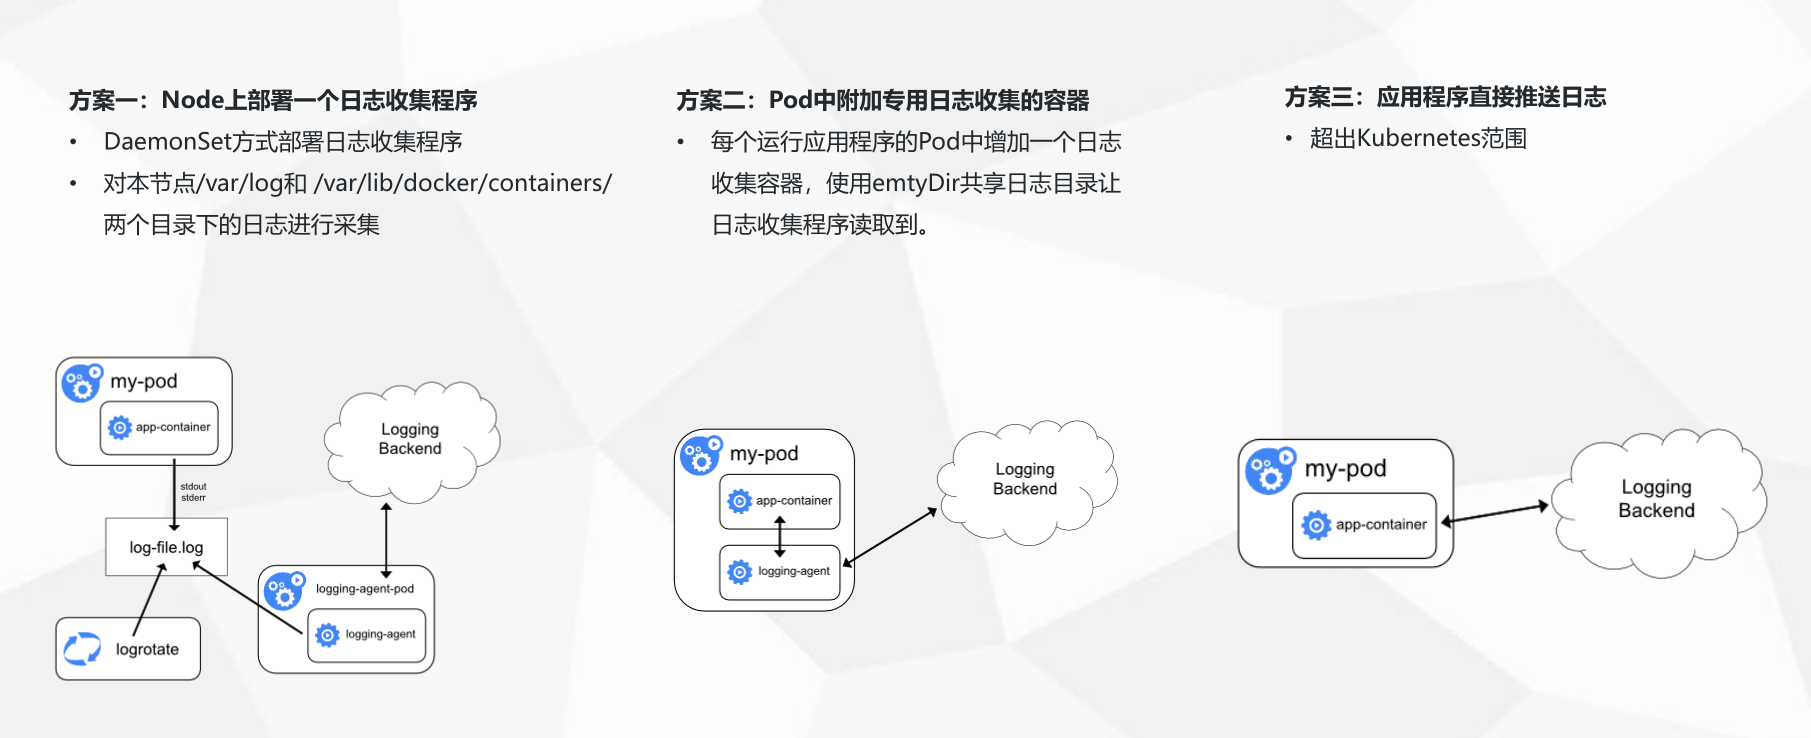
三种收集方案的优缺点:

下面我们就实践第二种日志收集方案:
一、安装ELK
下面直接采用yum的方式安装ELK(源码包安装参考:https://www.cnblogs.com/Dev0ps/p/9309103.html)
1.安装jdk
yum install -y java
2.添加ELK源
cat << EOF >>/etc/yum.repos.d/logstash.repo
[logstash-7.x]
name=Elastic repository for 7.x packages
baseurl=https://artifacts.elastic.co/packages/7.x/yum
gpgcheck=1
gpgkey=https://artifacts.elastic.co/GPG-KEY-elasticsearch
enabled=1
autorefresh=1
type=rpm-md
EOF
3.安装ELK组件
yum install elasticsearch logstash kibana -y
4.修改kibana的配置文件
[root@master ~]# grep -Ev '^$|^#' /etc/kibana/kibana.yml
server.port: 5601
server.host: "0.0.0.0"
elasticsearch.hosts: ["http://localhost:9200"]
5.启动服务
systemctl start elasticsearch
systemctl start kibana
二、收集k8s的日志
1.添加logstash配置文件
input {
  beats {
     port => 5044
  }
}


filter {
}

output {
       if [app] == "k8s" {
        if [type] == "module" {
           elasticsearch {
              hosts => ["http://127.0.0.1:9200"]
              index => "k8s-log-%{+YYYY.MM.dd}"
           }
        }
    }
}
2.启动logstash
/usr/share/logstash/bin/logstash -f /etc/logstash/conf.d/logstash-to-es.conf &
3.创建filebeat的yaml文件
[root@master logs]# cat k8s-logs.yaml
apiVersion: v1
kind: ConfigMap
metadata:
  name: k8s-logs-filebeat-config
  namespace: kube-system

data:
  filebeat.yml: |-
    filebeat.prospectors:
      - type: log
        paths:
          - /messages
        fields:
          app: k8s
          type: module
        fields_under_root: true

    output.logstash:
      hosts: ['172.31.182.140:5044']

---

apiVersion: apps/v1
kind: DaemonSet
metadata:
  name: k8s-logs
  namespace: kube-system
spec:
  selector:
    matchLabels:
      project: k8s
      app: filebeat
  template:
    metadata:
      labels:
        project: k8s
        app: filebeat
    spec:
      containers:
      - name: filebeat
        image: docker.elastic.co/beats/filebeat:6.4.2
        args: [
          "-c", "/etc/filebeat.yml",
          "-e",
        ]
        resources:
          requests:
            cpu: 100m
            memory: 100Mi
          limits:
            cpu: 500m
            memory: 500Mi
        securityContext:
          runAsUser: 0
        volumeMounts:
        - name: filebeat-config
          mountPath: /etc/filebeat.yml
          subPath: filebeat.yml
        - name: k8s-logs
          mountPath: /messages
      volumes:
      - name: k8s-logs
        hostPath:
          path: /var/log/messages
          type: File
      - name: filebeat-config
        configMap:
          name: k8s-logs-filebeat-config
4.创建pod
kubectl apply -f k8s-logs.yaml
5.kibana添加索引
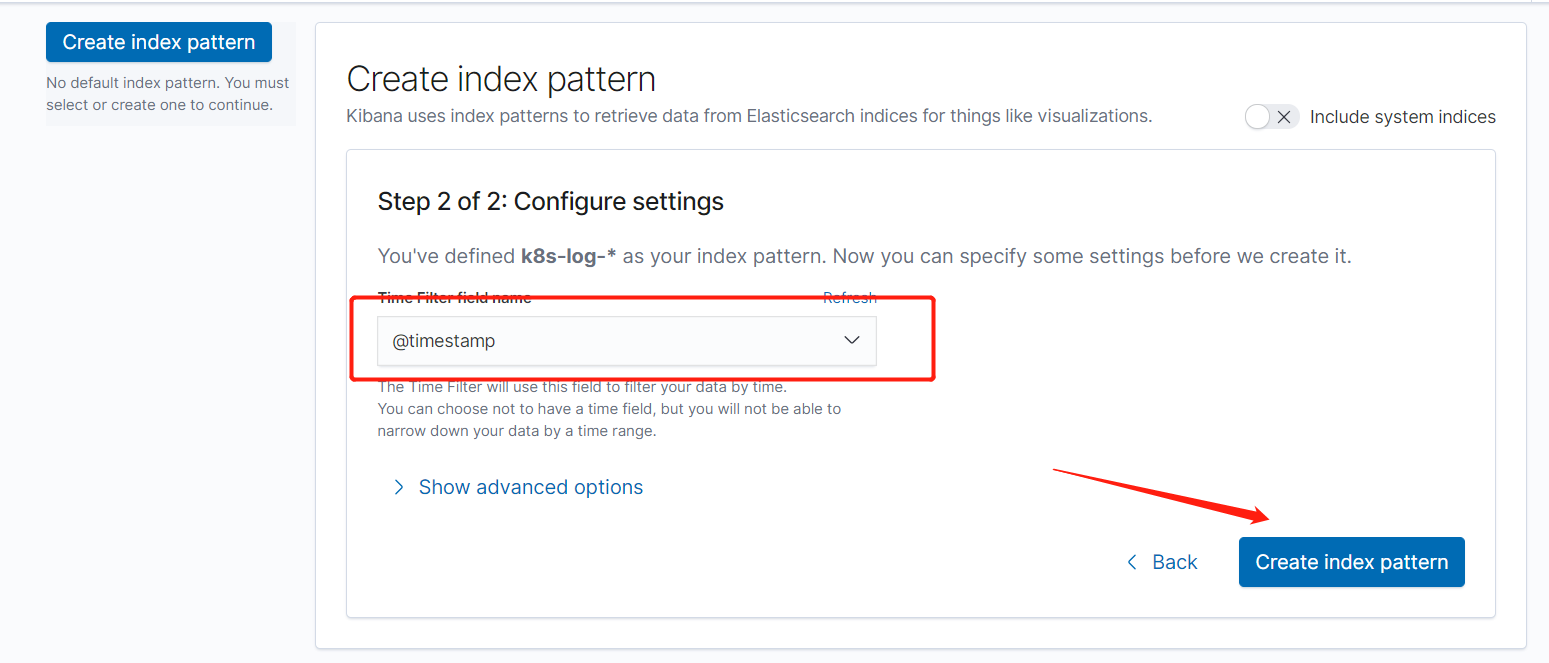

三、收集nginx日志
1.创建nginx-deployment
默认的日志路径为:/var/log/nginx/
[root@master logs]# cat nginx-deployment.yaml
apiVersion: apps/v1beta1
kind: Deployment
metadata:
  name: nginx-demo
#  namespace: test
spec:
  replicas: 3
  selector:
    matchLabels:
      project: www
      app: www
  template:
    metadata:
      labels:
        project: www
        app: www
    spec:
      imagePullSecrets:
      - name: registry-pull-secret
      containers:
      - name: nginx
        image: nginx:latest
        imagePullPolicy: Always
        ports:
        - containerPort: 80
          name: web
          protocol: TCP
        resources:
          requests:
            cpu: 0.5
            memory: 256Mi
          limits:
            cpu: 1
            memory: 1Gi
        resources:
          requests:
            cpu: 0.5
            memory: 256Mi
          limits:
            cpu: 1
            memory: 1Gi
        livenessProbe:
          httpGet:
            path: /index.html
            port: 80
          initialDelaySeconds: 6
          timeoutSeconds: 20
        volumeMounts:
        - name: nginx-logs
          mountPath: /var/log/nginx/

      - name: filebeat
        image: docker.elastic.co/beats/filebeat:6.4.2
        args: [
          "-c", "/etc/filebeat.yml",
          "-e",
        ]
        resources:
          limits:
            memory: 500Mi
          requests:
            cpu: 100m
            memory: 100Mi
        securityContext:
          runAsUser: 0
        volumeMounts:
        - name: filebeat-config
          mountPath: /etc/filebeat.yml
          subPath: filebeat.yml
        - name: nginx-logs
          mountPath: /var/log/nginx/

      volumes:
      - name: nginx-logs
        emptyDir: {}
      - name: filebeat-config
        configMap:
          name: filebeat-nginx-config
2.创建filebest收集日志
[root@master logs]# cat filebeat-nginx-configmap.yaml
apiVersion: v1
kind: ConfigMap
metadata:
  name: filebeat-nginx-config
#  namespace: test

data:
  filebeat.yml: |-
    filebeat.prospectors:
      - type: log
        paths:
          - /var/log/nginx/access.log
        # tags: ["access"]
        fields:
          app: www
          type: nginx-access
        fields_under_root: true

      - type: log
        paths:
          - /var/log/nginx/error.log
        # tags: ["error"]
        fields:
          app: www
          type: nginx-error
        fields_under_root: true

    output.logstash:
      hosts: ['172.31.182.140:5044']
3.添加logstas配置
[root@master logs]# cat /etc/logstash/conf.d/logstash-to-es.conf
input {
  beats {
     port => 5044
  }
}


filter {
}

output {
    if [app] == "www" {
        if [type] == "nginx-access" {
           elasticsearch {
              hosts => ["http://127.0.0.1:9200"]
              index => "nginx-access-%{+YYYY.MM.dd}"
           }
        }
        else if [type] == "nginx-error" {
           elasticsearch {
              hosts => ["http://127.0.0.1:9200"]
              index => "nginx-error-%{+YYYY.MM.dd}"
           }
        }
    } else if [app] == "k8s" {
        if [type] == "module" {
           elasticsearch {
              hosts => ["http://127.0.0.1:9200"]
              index => "k8s-log-%{+YYYY.MM.dd}"
           }
        }
    }
#  stdout { codec=> rubydebug }
}
4.kibana添加索引
四、收集tomcat日志
1.1.创建tomcat-deployment
默认的日志路径为:/usr/local/tomcat/logs
[root@master logs]# cat tomcat-deployment.yaml
apiVersion: apps/v1beta1
kind: Deployment
metadata:
  name: tomcat-java-demo
#  namespace: test
spec:
  replicas: 3
  selector:
    matchLabels:
      project: www
      app: www
  template:
    metadata:
      labels:
        project: www
        app: www
    spec:
      imagePullSecrets:
      - name: registry-pull-secret
      containers:
      - name: tomcat
        image: tomcat:latest
        imagePullPolicy: Always
        ports:
        - containerPort: 8080
          name: web
          protocol: TCP
        resources:
          requests:
            cpu: 0.5
            memory: 1Gi
          limits:
            cpu: 1
            memory: 2Gi
        livenessProbe:
          httpGet:
            path: /
            port: 8080
          initialDelaySeconds: 60
          timeoutSeconds: 20
        readinessProbe:
          httpGet:
            path: /
            port: 8080
          initialDelaySeconds: 60
          timeoutSeconds: 20
        volumeMounts:
        - name: tomcat-logs
          mountPath: /usr/local/tomcat/logs

      - name: filebeat
        image: docker.elastic.co/beats/filebeat:6.4.2
        args: [
          "-c", "/etc/filebeat.yml",
          "-e",
        ]
        resources:
          limits:
            memory: 500Mi
          requests:
            cpu: 100m
            memory: 100Mi
        securityContext:
          runAsUser: 0
        volumeMounts:
        - name: filebeat-config
          mountPath: /etc/filebeat.yml
          subPath: filebeat.yml
        - name: tomcat-logs
          mountPath: /usr/local/tomcat/logs
      volumes:
      - name: tomcat-logs
        emptyDir: {}
      - name: filebeat-config
        configMap:
          name: filebeat-config
2.创建filebest收集tomcat日志
[root@master logs]# cat filebeat-tomcat-configmap.yaml
apiVersion: v1
kind: ConfigMap
metadata:
  name: filebeat-config
#  namespace: test

data:
  filebeat.yml: |-
    filebeat.prospectors:
    - type: log
      paths:
        - /usr/local/tomcat/logs/catalina.*
      # tags: ["tomcat"]
      fields:
        app: www
        type: tomcat-catalina
      fields_under_root: true
      multiline:
        pattern: '^['
        negate: true
        match: after
    output.logstash:
      hosts: ['172.31.182.140:5044']
3.添加logstas配置后重启
[root@master logs]# cat /etc/logstash/conf.d/logstash-to-es.conf
input {
  beats {
     port => 5044
  }
}


filter {
}

output {
    if [app] == "www" {
        if [type] == "nginx-access" {
           elasticsearch {
              hosts => ["http://127.0.0.1:9200"]
              index => "nginx-access-%{+YYYY.MM.dd}"
           }
        }
        else if [type] == "nginx-error" {
           elasticsearch {
              hosts => ["http://127.0.0.1:9200"]
              index => "nginx-error-%{+YYYY.MM.dd}"
           }
        }
        else if [type] == "tomcat-catalina" {
           elasticsearch {
              hosts => ["http://127.0.0.1:9200"]
              index => "tomcat-catalina-%{+YYYY.MM.dd}"
           }
        }
    } else if [app] == "k8s" {
        if [type] == "module" {
           elasticsearch {
              hosts => ["http://127.0.0.1:9200"]
              index => "k8s-log-%{+YYYY.MM.dd}"
           }
        }
    }
#  stdout { codec=> rubydebug }
}
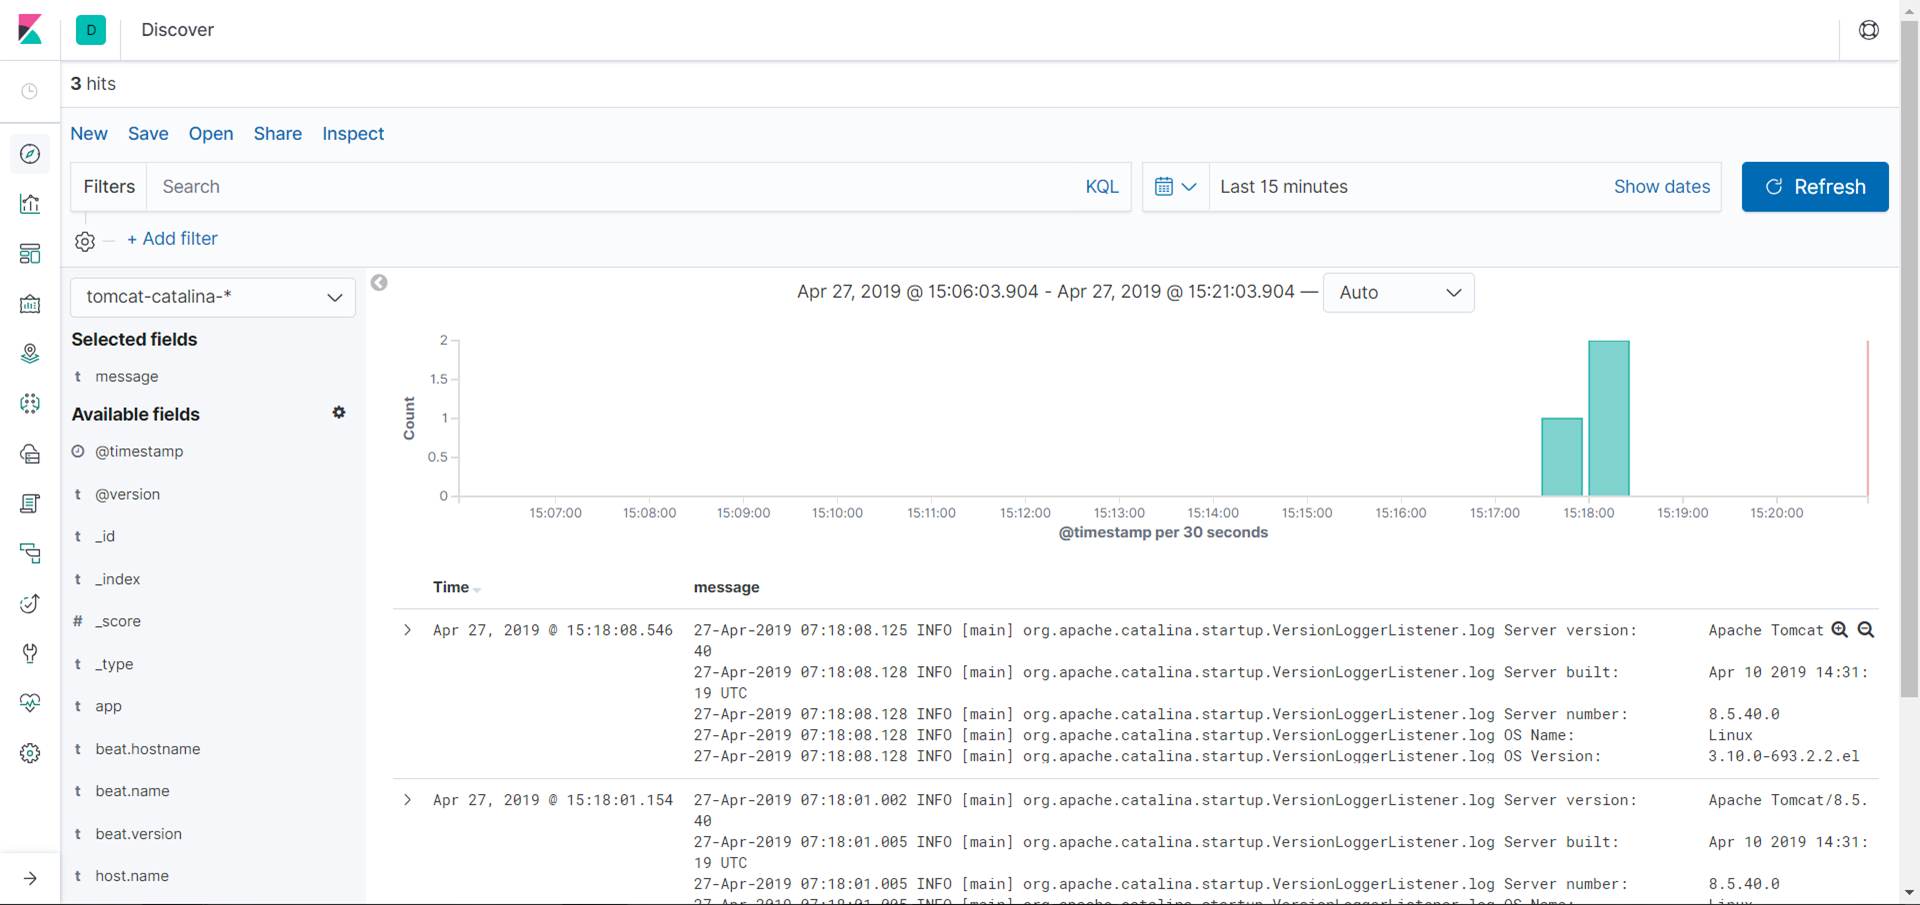
4.kibana添加索引