通过npm 安装
npm install highcharts --save然后在components文件夹下创建 hightBar 文件夹以及 highcharts.vue和index.js 文件
highcharts.vue写入要封装的内容
<template>
  <div :class="bar_class"></div>
</template>

<script>
import Highcharts from 'highcharts/highstock';
import HighchartsMore from 'highcharts/highcharts-more';
import HighchartsDrilldown from 'highcharts/modules/drilldown';
import Highcharts3D from 'highcharts/highcharts-3d';
HighchartsMore(Highcharts)
HighchartsDrilldown(Highcharts);
Highcharts3D(Highcharts);

export default {
  props: ['options', 'styles','bar_class'],
  name: 'highcharts',
  data() {
    return {
      chart: null
    }
  },
  mounted() {
    this.initChart();
  },
  methods: {
    initChart() {
      this.$el.style.width = (this.styles.width || 800) + 'px';
      this.$el.style.height = (this.styles.height || 400) + 'px';
      this.chart = new Highcharts.Chart(this.$el, this.options);
    }
  }
}
</script>
index.js则把组件全局化
import highcharts from './highcharts.vue';

highcharts.install = function (Vue) {
    Vue.component(highcharts.name, highcharts);
};
export default highcharts;
然后在main.js中引入
import highcharts from '@/components/hightBar';
highcharts.install(Vue)
我们在页面使用时
<template>
<div>
<highcharts :bar_class="bar_canvas" :options="options" :styles="styles" ></highcharts>
</div>
</template>
<script>
export default {
data() {
return {
styles: {
"500px",
height: "500px"
},
bar_canvas:"bar_canvas",
options: {
chart: {
type: 'pie',
options3d: {
enabled: true,
alpha: 45,
beta: 0
}
},
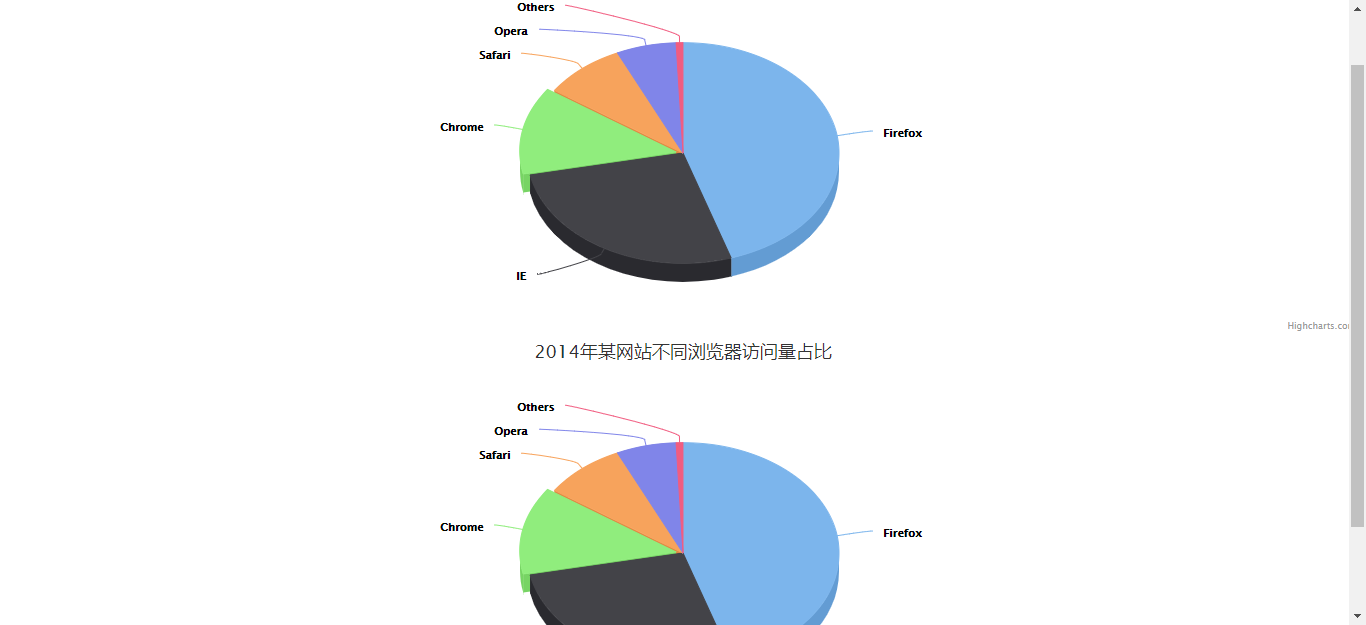
title: {
text: '2014年某网站不同浏览器访问量占比'
},
tooltip: {
pointFormat: '{series.name}: <b>{point.percentage:.1f}%</b>'
},
plotOptions: {
pie: {
allowPointSelect: true,
cursor: 'pointer',
depth: 35,
dataLabels: {
enabled: true,
format: '{point.name}'
}
}
},
series: [{
type: 'pie',
name: '浏览器占比',
data: [
['Firefox', 45.0],
['IE', 26.8],
{
name: 'Chrome',
y: 12.8,
sliced: true,
selected: true
},
['Safari', 8.5],
['Opera', 6.2],
['Others', 0.7]
]
}]
}
};
},
};
</script>
出现的效果就是我们要的