花了很长时间才搞好的tensorboard的使用 详细说明
一、输入代码
首先在Spyder输入代码
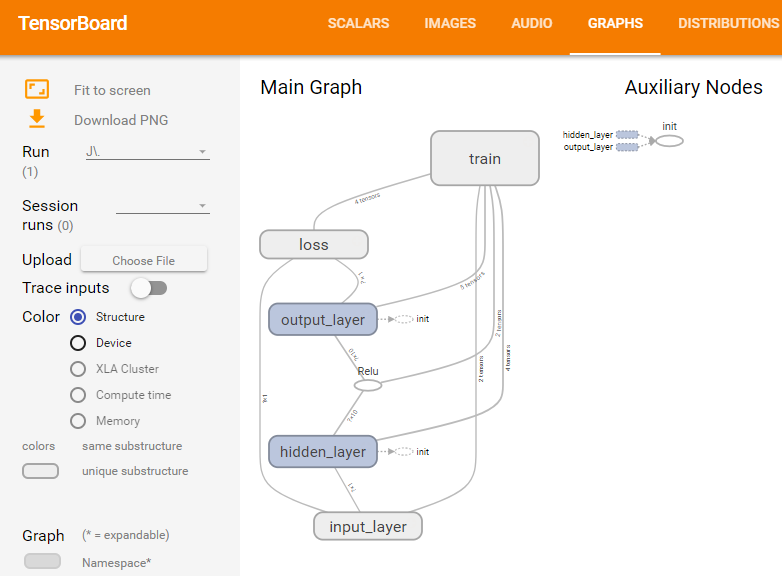
import tensorflow as tf
import numpy as np

#输入数据
x_data = np.linspace(-1,1,300)[:, np.newaxis]
noise = np.random.normal(0,0.05, x_data.shape)
y_data = np.square(x_data)-0.5+noise

#输入层
with tf.name_scope('input_layer'): #输入层。将这两个变量放到input_layer作用域下,tensorboard会把他们放在一个图形里面
    xs = tf.placeholder(tf.float32, [None, 1], name = 'x_input') # xs起名x_input,会在图形上显示
    ys = tf.placeholder(tf.float32, [None, 1], name = 'y_input') # ys起名y_input,会在图形上显示

#隐层
with tf.name_scope('hidden_layer'): #隐层。将隐层权重、偏置、净输入放在一起
    with tf.name_scope('weight'): #权重
        W1 = tf.Variable(tf.random_normal([1,10]))
        tf.summary.histogram('hidden_layer/weight', W1)
    with tf.name_scope('bias'): #偏置
        b1 = tf.Variable(tf.zeros([1,10])+0.1)
        tf.summary.histogram('hidden_layer/bias', b1)
    with tf.name_scope('Wx_plus_b'): #净输入
        Wx_plus_b1 = tf.matmul(xs,W1) + b1
        tf.summary.histogram('hidden_layer/Wx_plus_b',Wx_plus_b1)
output1 = tf.nn.relu(Wx_plus_b1)

#输出层
with tf.name_scope('output_layer'): #输出层。将输出层权重、偏置、净输入放在一起
    with tf.name_scope('weight'): #权重
        W2 = tf.Variable(tf.random_normal([10,1]))
        tf.summary.histogram('output_layer/weight', W2)
    with tf.name_scope('bias'): #偏置
        b2 = tf.Variable(tf.zeros([1,1])+0.1)
        tf.summary.histogram('output_layer/bias', b2)
    with tf.name_scope('Wx_plus_b'): #净输入
        Wx_plus_b2 = tf.matmul(output1,W2) + b2
        tf.summary.histogram('output_layer/Wx_plus_b',Wx_plus_b2)
output2 = Wx_plus_b2

#损失
with tf.name_scope('loss'): #损失
    loss = tf.reduce_mean(tf.reduce_sum(tf.square(ys-output2),reduction_indices=[1]))
    tf.summary.scalar('loss',loss)
with tf.name_scope('train'): #训练过程
    train_step = tf.train.GradientDescentOptimizer(0.1).minimize(loss)

#初始化
init = tf.global_variables_initializer()
sess = tf.Session()
sess.run(init)
merged = tf.summary.merge_all() #将图形、训练过程等数据合并在一起
writer = tf.summary.FileWriter('logs',sess.graph) #将训练日志写入到logs文件夹下

#训练
for i in range(1000):
    sess.run(train_step,feed_dict={xs:x_data,ys:y_data})
    if(i%50==0): #每50次写一次日志
        result = sess.run(merged,feed_dict={xs:x_data,ys:y_data}) #计算需要写入的日志数据
        writer.add_summary(result,i) #将日志数据写入文件
执行当前代码,会在当前目录/logs”目录下生成一个events.out.tfevents.{time}.{machine-name}的文件
二、tensorboard
打开终端:在cmd中打开和在AnacondaPrompt中打开是一样,主要是路径等等的设置相同就行
这里选择直接在cmd中打开
注意:
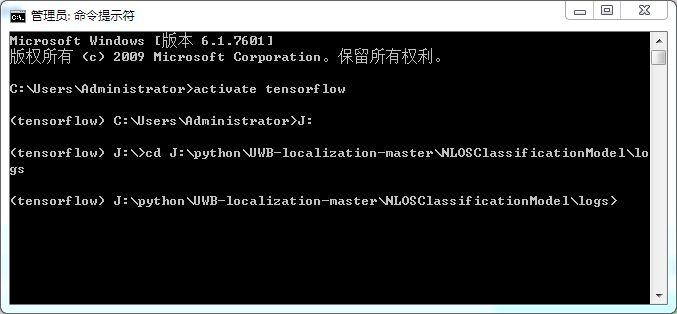
- 激活TensorFlow环境
- 进入到logs所在的目录
之后输入:
tensorboard --logdir=logs
注意:其中logs表示文件目录,不用加""
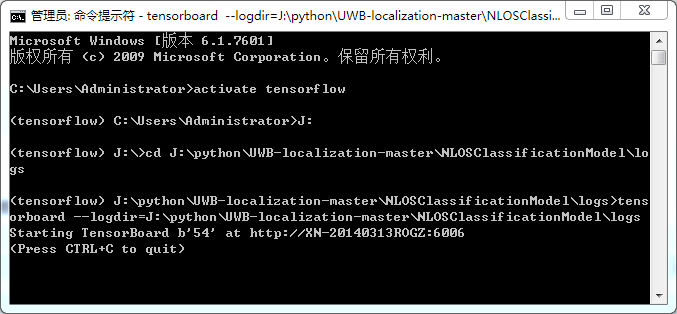
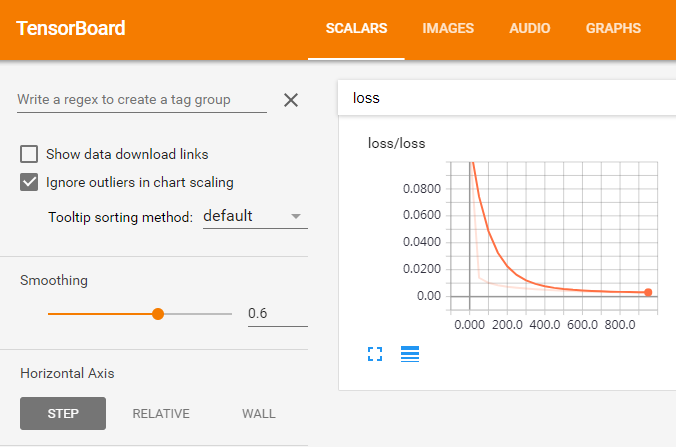
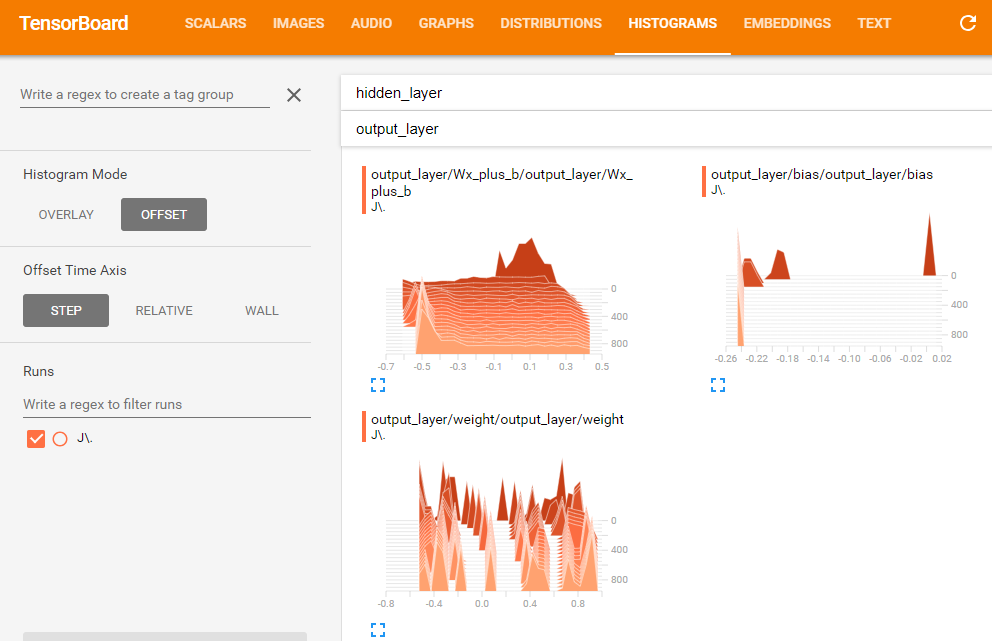
执行上述bat文件,打开浏览器,输入地址:http://localhost:6006,或者http://XN-20140313ROGZ:6006,就可以查看训练过程中的各种图形。
其他好的文章