分类问题项目流程:
- 如何端到端的完成一个分类问题的模型
- 如何通过数据转换提高模型的准确度
- 如何通过调参提高模型的准确度
- 如何通过算法集成提高模型的准确度
问题定义
在这个项目中采用声纳、矿山和岩石数据集(http://archive.ics.uci.edu/ml/datasets/Connectionist+Bench+%28Sonar%2C+Mines+vs.+Rocks%29)。通过声纳返回的信息判断物质是金属还是岩石。这个数据集共有208条记录,每条记录了60中不同的声纳探测数据和一个分类结果,若是岩石则标记为R,若是金属则标记为M。
导入数据
在导入之前,先需要导入所需的类库。
 1 #60中声纳探测预测
 2 import numpy as np
 3 from matplotlib import pyplot
 4 from pandas import read_csv
 5 from pandas import set_option
 6 from pandas.plotting import scatter_matrix
 7 from sklearn.preprocessing import StandardScaler
 8 from sklearn.model_selection import train_test_split
 9 from sklearn.model_selection import KFold
10 from sklearn.model_selection import cross_val_score
11 from sklearn.model_selection import GridSearchCV
12 from sklearn.metrics import classification_report
13 from sklearn.metrics import confusion_matrix
14 from sklearn.metrics import accuracy_score
15 from sklearn.pipeline import Pipeline
16 from sklearn.linear_model import LogisticRegression
17
18 from sklearn.tree import DecisionTreeClassifier
19 from sklearn.discriminant_analysis import LinearDiscriminantAnalysis
20 from sklearn.neighbors import KNeighborsRegressor
21 from sklearn.tree import DecisionTreeClassifier
22 from sklearn.naive_bayes import GaussianNB
23 from sklearn.svm import SVC
24
25 from sklearn.ensemble import RandomForestClassifier
26 from sklearn.ensemble import GradientBoostingClassifier
27 from sklearn.ensemble import ExtraTreesClassifier
28 from sklearn.ensemble import AdaBoostClassifier
29
30 #导入数据
31 filename='/home/aistudio/work/sonar.all-data.csv'
32 dataset=read_csv(filename,header=None)
因为每条记录都是60种不同的声纳探测结果,没有办法提供合适的名字,所以导入时没有指定特征属性名。
数据理解
先确认数据的维度,例如记录的条数和数据特征属性的个数:
1 #数据维度
2 print(dataset.shape)
执行结果显示数据有208条记录和61个数据特征属性(包含60此声纳探测数据和一个分类结果)。
(208, 61)
接下来看一下各个数据特征和数据类型。
1 #查看数据类型
2 set_option('display.max_rows',500)
3 print(dataset.dtypes)
结果显示所有的特征属性的数据类型都是数字。

 1 0     float64
 2 1     float64
 3 2     float64
 4 3     float64
 5 4     float64
 6 5     float64
 7 6     float64
 8 7     float64
 9 8     float64
10 9     float64
11 10    float64
12 11    float64
13 12    float64
14 13    float64
15 14    float64
16 15    float64
17 16    float64
18 17    float64
19 18    float64
20 19    float64
21 20    float64
22 21    float64
23 22    float64
24 23    float64
25 24    float64
26 25    float64
27 26    float64
28 27    float64
29 28    float64
30 29    float64
31 30    float64
32 31    float64
33 32    float64
34 33    float64
35 34    float64
36 35    float64
37 36    float64
38 37    float64
39 38    float64
40 39    float64
41 40    float64
42 41    float64
43 42    float64
44 43    float64
45 44    float64
46 45    float64
47 46    float64
48 47    float64
49 48    float64
50 49    float64
51 50    float64
52 51    float64
53 52    float64
54 53    float64
55 54    float64
56 55    float64
57 56    float64
58 57    float64
59 58    float64
60 59    float64
61 60     object
62 dtype: object
再查看最开始的20条记录:
1 #查看最开始的20条记录
2 set_option('display.width',100)
3 print(dataset.head(20))

 1         0       1       2       3       4       5       6       7       8       9  ...      51
 2 0   0.0200  0.0371  0.0428  0.0207  0.0954  0.0986  0.1539  0.1601  0.3109  0.2111 ...  0.0027
 3 1   0.0453  0.0523  0.0843  0.0689  0.1183  0.2583  0.2156  0.3481  0.3337  0.2872 ...  0.0084
 4 2   0.0262  0.0582  0.1099  0.1083  0.0974  0.2280  0.2431  0.3771  0.5598  0.6194 ...  0.0232
 5 3   0.0100  0.0171  0.0623  0.0205  0.0205  0.0368  0.1098  0.1276  0.0598  0.1264 ...  0.0121
 6 4   0.0762  0.0666  0.0481  0.0394  0.0590  0.0649  0.1209  0.2467  0.3564  0.4459 ...  0.0031
 7 5   0.0286  0.0453  0.0277  0.0174  0.0384  0.0990  0.1201  0.1833  0.2105  0.3039 ...  0.0045
 8 6   0.0317  0.0956  0.1321  0.1408  0.1674  0.1710  0.0731  0.1401  0.2083  0.3513 ...  0.0201
 9 7   0.0519  0.0548  0.0842  0.0319  0.1158  0.0922  0.1027  0.0613  0.1465  0.2838 ...  0.0081
10 8   0.0223  0.0375  0.0484  0.0475  0.0647  0.0591  0.0753  0.0098  0.0684  0.1487 ...  0.0145
11 9   0.0164  0.0173  0.0347  0.0070  0.0187  0.0671  0.1056  0.0697  0.0962  0.0251 ...  0.0090
12 10  0.0039  0.0063  0.0152  0.0336  0.0310  0.0284  0.0396  0.0272  0.0323  0.0452 ...  0.0062
13 11  0.0123  0.0309  0.0169  0.0313  0.0358  0.0102  0.0182  0.0579  0.1122  0.0835 ...  0.0133
14 12  0.0079  0.0086  0.0055  0.0250  0.0344  0.0546  0.0528  0.0958  0.1009  0.1240 ...  0.0176
15 13  0.0090  0.0062  0.0253  0.0489  0.1197  0.1589  0.1392  0.0987  0.0955  0.1895 ...  0.0059
16 14  0.0124  0.0433  0.0604  0.0449  0.0597  0.0355  0.0531  0.0343  0.1052  0.2120 ...  0.0083
17 15  0.0298  0.0615  0.0650  0.0921  0.1615  0.2294  0.2176  0.2033  0.1459  0.0852 ...  0.0031
18 16  0.0352  0.0116  0.0191  0.0469  0.0737  0.1185  0.1683  0.1541  0.1466  0.2912 ...  0.0346
19 17  0.0192  0.0607  0.0378  0.0774  0.1388  0.0809  0.0568  0.0219  0.1037  0.1186 ...  0.0331
20 18  0.0270  0.0092  0.0145  0.0278  0.0412  0.0757  0.1026  0.1138  0.0794  0.1520 ...  0.0084
21 19  0.0126  0.0149  0.0641  0.1732  0.2565  0.2559  0.2947  0.4110  0.4983  0.5920 ...  0.0092
22
23         52      53      54      55      56      57      58      59  60
24 0   0.0065  0.0159  0.0072  0.0167  0.0180  0.0084  0.0090  0.0032   R
25 1   0.0089  0.0048  0.0094  0.0191  0.0140  0.0049  0.0052  0.0044   R
26 2   0.0166  0.0095  0.0180  0.0244  0.0316  0.0164  0.0095  0.0078   R
27 3   0.0036  0.0150  0.0085  0.0073  0.0050  0.0044  0.0040  0.0117   R
28 4   0.0054  0.0105  0.0110  0.0015  0.0072  0.0048  0.0107  0.0094   R
29 5   0.0014  0.0038  0.0013  0.0089  0.0057  0.0027  0.0051  0.0062   R
30 6   0.0248  0.0131  0.0070  0.0138  0.0092  0.0143  0.0036  0.0103   R
31 7   0.0120  0.0045  0.0121  0.0097  0.0085  0.0047  0.0048  0.0053   R
32 8   0.0128  0.0145  0.0058  0.0049  0.0065  0.0093  0.0059  0.0022   R
33 9   0.0223  0.0179  0.0084  0.0068  0.0032  0.0035  0.0056  0.0040   R
34 10  0.0120  0.0052  0.0056  0.0093  0.0042  0.0003  0.0053  0.0036   R
35 11  0.0265  0.0224  0.0074  0.0118  0.0026  0.0092  0.0009  0.0044   R
36 12  0.0127  0.0088  0.0098  0.0019  0.0059  0.0058  0.0059  0.0032   R
37 13  0.0095  0.0194  0.0080  0.0152  0.0158  0.0053  0.0189  0.0102   R
38 14  0.0057  0.0174  0.0188  0.0054  0.0114  0.0196  0.0147  0.0062   R
39 15  0.0153  0.0071  0.0212  0.0076  0.0152  0.0049  0.0200  0.0073   R
40 16  0.0158  0.0154  0.0109  0.0048  0.0095  0.0015  0.0073  0.0067   R
41 17  0.0131  0.0120  0.0108  0.0024  0.0045  0.0037  0.0112  0.0075   R
42 18  0.0010  0.0018  0.0068  0.0039  0.0120  0.0132  0.0070  0.0088   R
43 19  0.0035  0.0098  0.0121  0.0006  0.0181  0.0094  0.0116  0.0063   R
44
45 [20 rows x 61 columns]
数据的描述性统计信息:
1 #描述统计信息
2 set_option('precision',3)
3 print(dataset.describe())
可以看到,数据具有相同的范围,但是中位值不同,这也许对数据正太化的结果有正面的影响。

 1    0          1        2        3        4        5        6        7        8        9
 2 count  208.000  2.080e+02  208.000  208.000  208.000  208.000  208.000  208.000  208.000  208.000
 3 mean     0.029  3.844e-02    0.044    0.054    0.075    0.105    0.122    0.135    0.178    0.208
 4 std      0.023  3.296e-02    0.038    0.047    0.056    0.059    0.062    0.085    0.118    0.134
 5 min      0.002  6.000e-04    0.002    0.006    0.007    0.010    0.003    0.005    0.007    0.011
 6 25%      0.013  1.645e-02    0.019    0.024    0.038    0.067    0.081    0.080    0.097    0.111
 7 50%      0.023  3.080e-02    0.034    0.044    0.062    0.092    0.107    0.112    0.152    0.182
 8 75%      0.036  4.795e-02    0.058    0.065    0.100    0.134    0.154    0.170    0.233    0.269
 9 max      0.137  2.339e-01    0.306    0.426    0.401    0.382    0.373    0.459    0.683    0.711
10
11          ...           50         51         52       53         54         55         56
12 count    ...      208.000  2.080e+02  2.080e+02  208.000  2.080e+02  2.080e+02  2.080e+02
13 mean     ...        0.016  1.342e-02  1.071e-02    0.011  9.290e-03  8.222e-03  7.820e-03
14 std      ...        0.012  9.634e-03  7.060e-03    0.007  7.088e-03  5.736e-03  5.785e-03
15 min      ...        0.000  8.000e-04  5.000e-04    0.001  6.000e-04  4.000e-04  3.000e-04
16 25%      ...        0.008  7.275e-03  5.075e-03    0.005  4.150e-03  4.400e-03  3.700e-03
17 50%      ...        0.014  1.140e-02  9.550e-03    0.009  7.500e-03  6.850e-03  5.950e-03
18 75%      ...        0.021  1.673e-02  1.490e-02    0.015  1.210e-02  1.058e-02  1.043e-02
19 max      ...        0.100  7.090e-02  3.900e-02    0.035  4.470e-02  3.940e-02  3.550e-02
20
21               57         58         59
22 count  2.080e+02  2.080e+02  2.080e+02
23 mean   7.949e-03  7.941e-03  6.507e-03
24 std    6.470e-03  6.181e-03  5.031e-03
25 min    3.000e-04  1.000e-04  6.000e-04
26 25%    3.600e-03  3.675e-03  3.100e-03
27 50%    5.800e-03  6.400e-03  5.300e-03
28 75%    1.035e-02  1.033e-02  8.525e-03
29 max    4.400e-02  3.640e-02  4.390e-02
30
31 [8 rows x 60 columns]
最后看一下数据的分类分布:
1 #数据的分类与分布
2 print(dataset.groupby(60).size())
60
M    111
R     97
dtype: int64
数据可视化
1 #直方图
2 dataset.hist(sharex=False,sharey=False,xlabelsize=1,ylabelsize=1)
3 pyplot.show()
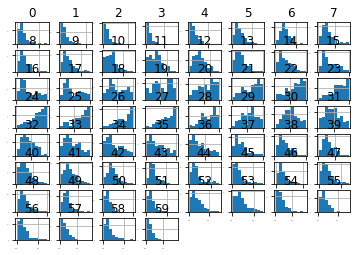
下图中显示,大部分数据呈高斯分布或指数分布
接下来看下密度分布图:
1 #密度图
2 dataset.plot(kind='density',subplots=True,layout=(8,8),sharex=False,legend=False, fontsize=1)
3 pyplot.show()
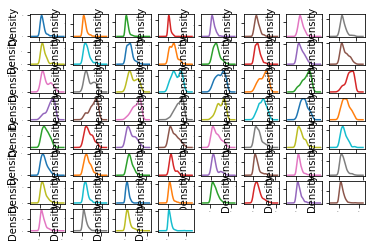
可以看到大部分数据呈现一定程度的偏态分布,也许通过Box-Cox转换可以提高模型的准确度。
Box-Cox转换是统计中常用的一种数据变化方式,用于连续响应变量不满足正太分布的情况。Box-Cox转换后,可以在一定程度上减少不可观测的误差,也可以预测变量的相关性,将数据转换成正太分布。
接下来看一下数据特征的两两相关性:
1 #关系矩阵图
2 fig=pyplot.figure()
3 ax=fig.add_subplot(111)
4 cax=ax.matshow(dataset.corr(),vmin=-1,vmax=1,interpolation='none')
5 fig.colorbar(cax)
6 pyplot.show()
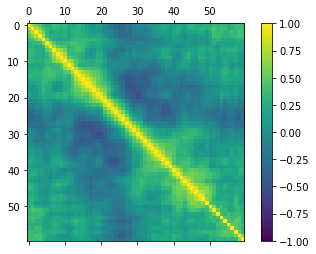
可以看到数据有一定的负先关性:
分离评估数据集
按照常规,2:8分:
1 #分离评估数据集
2 array=dataset.values
3 x=array[:,0:60].astype(float)
4 y=array[:,60]
5 validation_size=0.2
6 seed=7
7 x_train,x_validation,y_train,y_validation=train_test_split(x,y,test_size=validation_size,random_state=seed)
评估算法
采用10折交叉验证来分离数据,并通过准确度来比较算法,这样可以很快的找到最优算法:
1 #评估算法--评估标准
2 num_folds=10
3 seed=7
4 scoring='accuracy'
同上一节一样,首先利用原始数据对算法进行审查,下面会选择六种不同的算法进行审查。
线性算法:罗辑回归(LR)和线性判别分析(LDA)
非线性算法:分类与回归树算法(CART),支持向量机(SVM),贝叶斯分类器(NB)和K近邻(KNN)
算法模型初始化代码如下:
1 models={}
2 models['LR']=LogisticRegression()
3 models['LDA']=LinearDiscriminantAnalysis()
4 models['KNN']=KNeighborsClassifier()
5 models['CART']=DecisionTreeClassifier()
6 models['NB']=GaussianNB()
7 models['SVM']=SVC()
对所有的算法都不进行调参,使用默认的参数来比较算法。通过比较准确度的平均值和标准方差来比较算法:
1 results=[]
2 for key in models:
3     kfold=KFold(n_splits=num_folds,random_state=seed)
4     cv_results=cross_val_score(models[key],x_train,y_train,cv=kfold,scoring=scoring)
5     results.append(cv_results)
6     print('%s: %f (%f)' % (key,cv_results.mean(),cv_results.std()))
执行结果显示,逻辑回归算法(LR)和K近邻(KNN)值得我们进一步分析。
LR: 0.782721 (0.093796)
LDA: 0.746324 (0.117854)
KNN: 0.808088 (0.067507)
CART: 0.727941 (0.102731)
NB: 0.648897 (0.141868)
SVM: 0.608824 (0.118656)
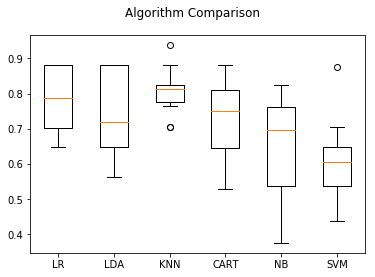
这只是K折交叉验证给出的平均统计结果,通常还要看每次得出的结果分布状况。在这里使用箱线图来显示数据分布。
1 #评估算法----箱线图
2 fig=pyplot.figure()
3 fig.suptitle('Algorithm Comparison')
4 ax=fig.add_subplot(111)
5 pyplot.boxplot(results)
6 ax.set_xticklabels(models.keys())
7 pyplot.show()
如下图所示,K近邻算法的执行结果分布比较紧凑,说明算法对数据的处理比较准确,但是,支持向量机(svm)的结果较差。
可能是数据分布的多样性导致SVM算法不够准确,接下来会对数据进行正太化,然后重新评估算法。
下面采用Pipeline来流程化处理:
 1 #评估算法----正太化数据
 2 pipelines={}
 3 pipelines['ScalerLR']=Pipeline([('Scaler',StandardScaler()),('LR',LogisticRegression())])
 4 pipelines['ScalerLDA']=Pipeline([('Scaler',StandardScaler()),('LDA',LinearDiscriminantAnalysis())])
 5 pipelines['ScalerKNN']=Pipeline([('Scaler',StandardScaler()),('KNN',KNeighborsClassifier())])
 6 pipelines['ScalerCART']=Pipeline([('Scaler',StandardScaler()),('CART',DecisionTreeClassifier())])
 7 pipelines['ScalerNB']=Pipeline([('Scaler',StandardScaler()),('NB',GaussianNB())])
 8 pipelines['ScalerSVM']=Pipeline([('Scaler',StandardScaler()),('SVM',SVC())])
 9
10 results=[]
11 for key in pipelines:
12     kfold=KFold(n_splits=num_folds,random_state=seed)
13     cv_results=cross_val_score(pipelines[key],x_train,y_train,cv=kfold,scoring=scoring)
14     results.append(cv_results)
15     print('%s: %f (%f)' % (key,cv_results.mean(),cv_results.std()))
从执行结果来看,K近邻依然具有最好的结果,甚至还有所提高,同时SVM也得到了极大的提高。
ScalerLR: 0.734191 (0.095885)
ScalerLDA: 0.746324 (0.117854)
ScalerKNN: 0.825735 (0.054511)
ScalerCART: 0.717647 (0.095103)
ScalerNB: 0.648897 (0.141868)
ScalerSVM: 0.836397 (0.088697)
再通过箱线图看看:
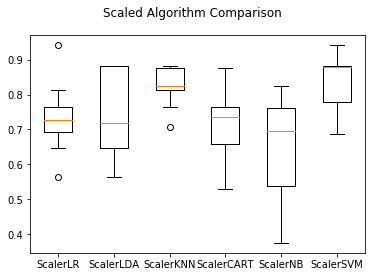
同样可以看到KNN和SVM的数据分布也是最紧凑的。
算法调参

下面就对KNN和SVM这两个算法进行调参,以进一步提高算法的准确度。
K近邻默认n_neighbors=5,下面对这个参数多试几组,采用相同的10折交叉验证来测试:
 1 #调参改进算法--KNN
 2 scaler=StandardScaler().fit(x_train)
 3 rescaledX=scaler.transform(x_train)
 4 param_grid={'n_neighbors':[1,3,5,7,9,11,13,15,17,19,21]}
 5 model=KNeighborsClassifier()
 6 kfold=KFold(n_splits=num_folds,random_state=seed)
 7 grid=GridSearchCV(estimator=model,param_grid=param_grid,scoring=scoring,cv=kfold)
 8 grid_result=grid.fit(X=rescaledX,y=y_train)
 9 print('最优:%s 使用%s' % (grid_result.best_score_,grid_result.best_params_))
10 cv_results = zip(grid_result.cv_results_['mean_test_score'],grid_result.cv_results_['std_test_score'],grid_result.cv_results_['params'])
11 for mean,std,param in cv_results:
12     print('%f (%f) with %r' % (mean, std, param))
执行结果如下:
最优:0.8493975903614458 使用{'n_neighbors': 1}
0.849398 (0.059881) with {'n_neighbors': 1}
0.837349 (0.066303) with {'n_neighbors': 3}
0.837349 (0.037500) with {'n_neighbors': 5}
0.765060 (0.089510) with {'n_neighbors': 7}
0.753012 (0.086979) with {'n_neighbors': 9}
0.734940 (0.104890) with {'n_neighbors': 11}
0.734940 (0.105836) with {'n_neighbors': 13}
0.728916 (0.075873) with {'n_neighbors': 15}
0.710843 (0.078716) with {'n_neighbors': 17}
0.722892 (0.084555) with {'n_neighbors': 19}
0.710843 (0.108829) with {'n_neighbors': 21}
得到最优的n_neighbors=1.
支持向量机有两个重要的参数,C(惩罚系数)和kernel(径向基函数),默认的C参数是1.0,kernal=rbf,下面将对这两个参数进行调参。
 1 #SVM--调参
 2 scaler=StandardScaler().fit(x_train)
 3 rescaledX=scaler.transform(x_train).astype(float)
 4 param_grid={}
 5 param_grid['C']=[0.1,0.3,0.5,0.7,0.9,1.0,1.3,1.5,1.7,2.0]
 6 param_grid['kernel']=['linear','poly','rbf','sigmoid','precomputed']
 7 model=SVC()
 8 kfold=KFold(n_splits=num_folds,random_state=seed)
 9 grid=GridSearchCV(estimator=model,param_grid=param_grid,scoring=scoring,cv=kfold)
10 grid_result=grid.fit(X=rescaledX, y=y_train)
11 print('最优:%s 使用%s' % (grid_result.best_score_,grid_result.best_params_))
12 cv_results=zip(grid_result.cv_results_['mean_test_score'],grid_result.cv_results_['std_test_score'],grid_result.cv_results_['param'])
13 for mean, std, param in cv_results:
14     print('%f (%f) with %r' % (mean, std, param))
上面的代码调试过程中有误,但我找不出原因(Line 10: ValueError: X should be a square kernel matrix),为了这本书的完整性,我还是贴出错误的代码。
书中给出的测试结果:
最好的支持向量机SVM的参数是C=1.5,kernel=RBF。准确度达到0.8675,这也比K近邻算法的结果要好一些。
集成算法
下面会对四种集成算法进行比较,以便进一步提高算法的准确度。
装袋算法:随机森林(RF)和极端随机树(ET)
提升算法:AdaBoost(AB)和随机梯度上升(GBM)
依然采用10折交叉验证集成算法的准确度,以便选择最优的算法模型。
 1 #集成算法
 2 num_folds=10
 3 scoring='accuracy'
 4
 5 ensembles={}
 6 ensembles['ScaledAB']=Pipeline([('Scaler',StandardScaler()),('AB',AdaBoostClassifier())])
 7 ensembles['ScaledGBM']=Pipeline([('Scaler',StandardScaler()),('GBM',GradientBoostingClassifier())])
 8 ensembles['ScaledRF']=Pipeline([('Scaler',StandardScaler()),('RFR',RandomForestClassifier())])
 9 ensembles['ScaledET']=Pipeline([('Scaler',StandardScaler()),('ETR',ExtraTreesClassifier())])
10
11 results=[]
12 for key in ensembles:
13     kfold=KFold(n_splits=num_folds,random_state=seed)
14     cv_result=cross_val_score(ensembles[key],x_train,y_train,cv=kfold,scoring=scoring)
15     results.append(cv_result)
16     print('%s: %f (%f)' % (key,cv_result.mean(),cv_result.std()))
执行结果如下:
ScaledAB: 0.813971 (0.066017)
ScaledGBM: 0.847794 (0.100189)
ScaledRF: 0.764338 (0.092898)
ScaledET: 0.771691 (0.097858)
通过箱线图来看一下算法结果的离散状况。
1 #集成算法----箱线图
2 fig=pyplot.figure()
3 fig.suptitle('Scaled Algorithm Comparison')
4 ax=fig.add_subplot(111)
5 pyplot.boxplot(results)
6 ax.set_xticklabels(ensembles.keys())
7 pyplot.show()
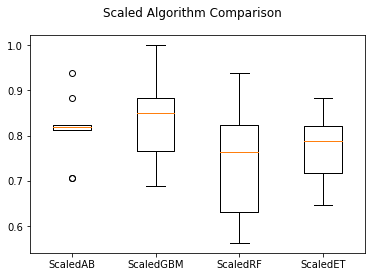
随机梯度上升(GBM)值得进一步分析,因为它具有良好的准确度,并且数据比较紧凑,接下来对其进行调参。
1 #集成算法GBM--调参
2 scaler=StandardScaler().fit(x_train)
3 rescaledX=scaler.transform(x_train)
4 param_grid={'n_estimators':[10,50,100,200,300,400,500,600,700,800,900]}
5 model=GradientBoostingClassifier()
6 kfold=KFold(n_splits=num_folds,random_state=seed)
7 grid=GridSearchCV(estimator=model,param_grid=param_grid,scoring=scoring,cv=kfold)
8 grid_result=grid.fit(X=rescaledX,y=y_train)
9 print('最优:%s 使用%s' % (grid_result.best_score_,grid_result.best_params_))
最优:0.8614457831325302 使用{'n_estimators': 200}
确定最终模型

依据上面的测试,采用支持向量机(SVM),通过训练集数据生成算法模型,并通过预留的评估数据来评估模型。
在算法评估过程中发现,支持向量机对正太化的数据具有较高的准确度,所以对训练集做正太化处理,对评估数据集也做相同的处理。
 1 #训练模型
 2 scaler=StandardScaler().fit(x_train)
 3 rescaledX=scaler.transform(x_train)
 4 model=SVC(C=1.5,kernel='rbf')
 5 model.fit(X=rescaledX,y=y_train)
 6
 7 #评估算法模型
 8 rescaledX_validation=scaler.transform(x_validation)
 9 predictions=model.predict(rescaledX_validation)
10 print(accuracy_score(y_validation,predictions))
11 print(confusion_matrix(y_validation,predictions))
12 print(classification_report(y_validation,predictions))
最优:0.8674698795180723 使用{'n_estimators': 500}
0.8571428571428571
[[23  4]
 [ 2 13]]
              precision    recall  f1-score   support

           M       0.92      0.85      0.88        27
           R       0.76      0.87      0.81        15

   micro avg       0.86      0.86      0.86        42
   macro avg       0.84      0.86      0.85        42
weighted avg       0.86      0.86      0.86        42

以上是只采用参数优化后的SVM得到的结果,看起来比集成算法效果还好。
