下载模块
pip install -i https://pypi.douban.com/simple matplotlib
1.饼图
#2.饼图
from matplotlib import pyplot as plt
from io import BytesIO

#1.用来正常显示中文标签
plt.rcParams['font.sans-serif'] = ['SimHei']
#用来正常显示负号
plt.rcParams['axes.unicode_minus'] = False
#2.画出饼图的关键就是定义标签和每一块的颜色
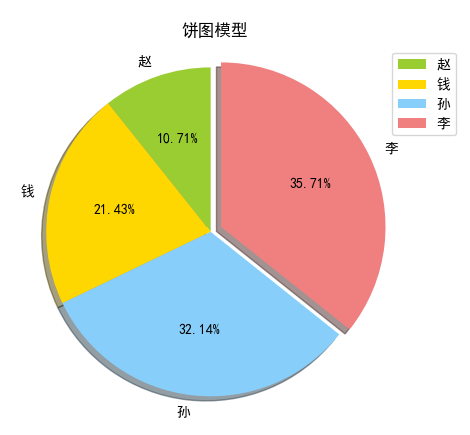
labels = ['赵', '钱', '孙', '李'] #饼图各区域名
sizes = [15, 30, 45, 50] #饼图各区域数值大小(不是百分比,饼图会自动转换为百分率)
colors = ['yellowgreen', 'gold', 'lightskyblue', 'lightcoral'] #各区域颜色
# colors=["r", "y", "g", "b", "c", "m"] #简写
explode = (0, 0, 0, 0.07) #各区域突出显示
#3.饼图标题
plt.title("饼图模型")
#4.生成饼图
plt.pie(sizes, explode=explode, labels=labels, colors=colors, autopct="%1.2f%%", shadow=True, startangle=90)
plt.axis('equal')  #避免比例压缩为椭圆
plt.legend() #显示各个区域名称汇总
#5.图片保存
sio1 = BytesIO()
plt.show()#显示图片
# plt.savefig("11.png") #保存图片到本地路径
# plt.savefig(sio1) #保存图片到内存中
#6.关闭
sio1.close()
plt.close()

2.折线图
参考
:https://blog.csdn.net/AXIMI/article/details/99308004?ops_request_misc=%257B%2522request%255Fid%2522%253A%2522161905958916780357228998%2522%252C%2522scm%2522%253A%252220140713.130102334..%2522%257D&request_id=161905958916780357228998&biz_id=0&utm_medium=distribute.pc_search_result.none-task-blog-2~all~top_positive~default-1-99308004.first_rank_v2_pc_rank_v29&utm_term=python%E6%8A%98%E7%BA%BF%E5%9B%BE
https://blog.csdn.net/weixin_45492196/article/details/99690698?utm_medium=distribute.pc_feed_404.none-task-blog-2~default~BlogCommendFromMachineLearnPai2~default-1.nonecase&dist_request_id=&depth_1-utm_source=distribute.pc_feed_404.none-task-blog-2~default~BlogCommendFromMachineLearnPai2~default-1.nonecas
from matplotlib import pyplot as plt
from io import BytesIO

#1.配置
#用来正常显示中文标签
plt.rcParams['font.sans-serif'] = ['SimHei']
#用来正常显示负号
plt.rcParams['axes.unicode_minus'] = False
#设置图表标题,并给坐标轴加上标签
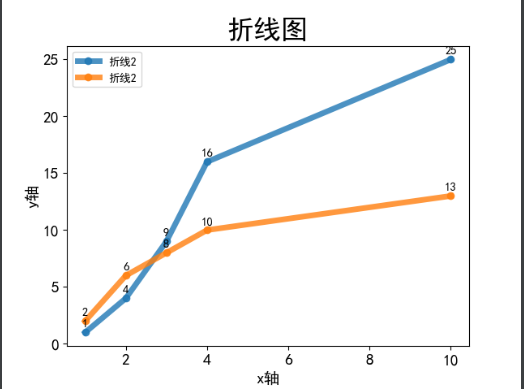
plt.title("折线图", fontsize=24)
plt.xlabel("x轴", fontsize=14)
plt.ylabel("y轴", fontsize=14)
#设置刻度标记的大小
plt.tick_params(axis='both', labelsize=14)
#2.折线图数据
x_ls = [1, 2, 3, 4, 10] #x轴的值
y1_ls = [1, 4, 9, 16, 25] #y轴的值
#3.绘制折线图
#3.1绘制第一条折线图
# plot中参数的含义分别是横轴值,纵轴值,线的形状(ro-可以显示每个数字点),颜色,透明度,线的宽度和标签
plt.plot(x_ls, y1_ls,'o-', alpha=0.8,linewidth=5,label='折线2') #绘制折线
#加标数据签
for x, y in zip(x_ls, y1_ls):
    plt.text(x, y+0.3, '%.0f' % y, ha='center', va='bottom', fontsize=10.5)
#绘制点
# x_values = [1, 2, 3, 4, 10]
# y_values = [1, 4, 9, 16, 25]
# plt.scatter(x_values, y_values, s=100)

#3.2绘制第二条折线
y2_ls = [2, 6, 8, 10, 13] #y轴的值
plt.plot(x_ls, y2_ls, 'o-',alpha=0.8,linewidth=5,label='折线2') #绘制折线
#加标数据签
for x, y in zip(x_ls, y2_ls):
    plt.text(x, y+0.3, '%.0f' % y, ha='center', va='bottom', fontsize=10.5)

#4.
plt.legend(loc="best")
# plt.legend()
#5.展示保存
plt.show()
#6.关闭
plt.close()

柱状图
并列柱状图
import matplotlib.pyplot as plt
import numpy as np

#1.这两行代码解决 plt 中文显示的问题
plt.rcParams['font.sans-serif'] = ['SimHei']
plt.rcParams['axes.unicode_minus'] = False

#2.输入统计数据
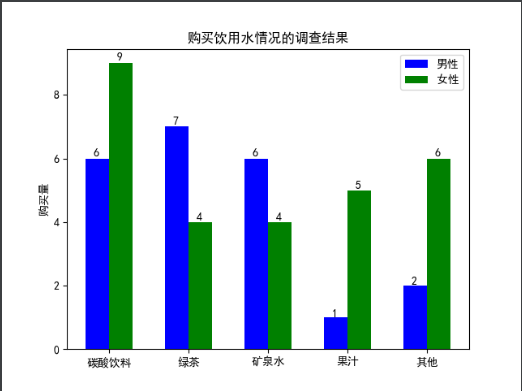
waters = ('碳酸饮料', '绿茶', '矿泉水', '果汁', '其他') #x轴
buy_number_male = [6, 7, 6, 1, 2] #y1轴
buy_number_female = [9, 4, 4, 5, 6] #y2轴

#3.设置坐标
bar_width = 0.3  # 条形宽度
index_male = np.arange(len(waters))  # 男生条形图的横坐标 [0 1 2 3 4]
index_female = index_male + bar_width  # 女生条形图的横坐标 [0.3 1.3 2.3 3.3 4.3]


#4.使用两次 bar 函数画出两组条形图
r1 = plt.bar(index_male, height=buy_number_male, width=bar_width, color='b', label='男性')
r2 = plt.bar(index_female, height=buy_number_female, width=bar_width, color='g', label='女性')

#柱状图数值
def autolabel(rects):
    for rect in rects:
        height = rect.get_height()
        plt.text(rect.get_x() + rect.get_width() / 1. - 0.2, 1.01 * height, '%s' % int(height))

autolabel(r1)
autolabel(r2)

#5.
plt.legend()  # 显示图例
plt.xticks(index_male + bar_width/2, waters)  # 让横坐标轴刻度显示 waters 里的饮用水, index_male + bar_width/2 为横坐标轴刻度的位置
plt.ylabel('购买量')  # 纵坐标轴标题
plt.title('购买饮用水情况的调查结果')  # 图形标题

#6.显示图片
plt.show()

单列柱状图
import matplotlib.pyplot as plt
import numpy as np

#单个柱状图
#1.这两行代码解决 plt 中文显示的问题
plt.rcParams['font.sans-serif'] = ['SimHei']
plt.rcParams['axes.unicode_minus'] = False
#2.x与y轴数据
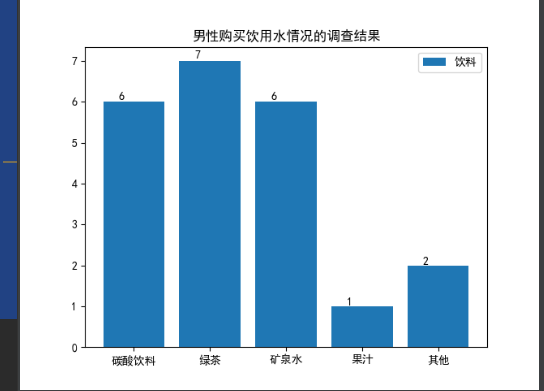
waters = ('碳酸饮料', '绿茶', '矿泉水', '果汁', '其他') #x轴
buy_number = [6, 7, 6, 1, 2] #y轴
#3.绘制
rects = plt.bar(waters, buy_number,label='饮料')
# 在柱状图上显示具体数值, ha参数控制水平对齐方式, va控制垂直对齐方式
for rect in rects:
    height = rect.get_height()
    plt.text(rect.get_x() + rect.get_width() / 2. - 0.2, 1.009 * height, '%s' % int(height))
#标题
plt.title('男性购买饮用水情况的调查结果')
#4.显示
plt.legend()
plt.show()
#5.关闭
plt.close()
