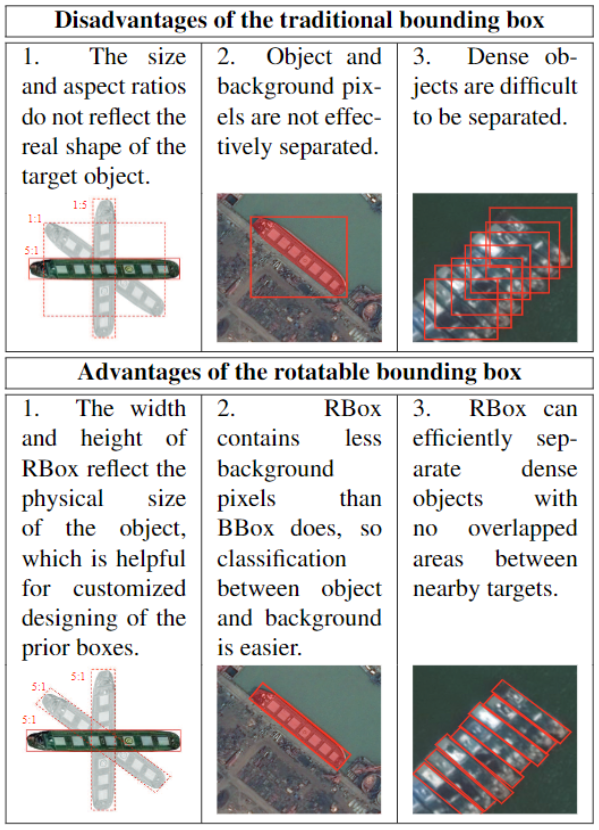
前情提要:旋转标记框,较之前普通的标记框可以更好的贴合目标物体。
- 参考链接:https://blog.csdn.net/qq_36449741/article/details/107366835

需求:将旋转的标记框绘制在图片上。
- 普通标记框可以通过 patches.Rectangle()方法进行绘制,虽然该方法有一个旋转角度的参数,但该方法的旋转方式是通过:以标记框左上角的标记点为中心进行旋转的,而不是以标记框的中心坐标进行旋转。
实现思路:
- 尝试了使用 patches.Rectangle()的旋转角度参数进行绘制,但怎么转换旋转后的坐标暂时没有搞清楚,故采取别的方式。
- patches.Rectangle()的目的是绘制矩形框,而矩形框可以由 4 条线段组成(相邻的线段互相垂直),那当然可以通过绘制 4 条线段的方式组成对应的标记框
链接:https://blog.csdn.net/weixin_47873308/article/details/113059744 ,中给出了 “ 一个点以另一个点为中心,计算旋转后的坐标公式 ”,故可以通过公式,得出旋转后矩形框 4 个点的坐标,进而绘制出对应矩形框。- 旋转公式具体如下
-
1 假设对图片上任意点(x,y),绕一个坐标点(rx0,ry0)逆时针旋转a角度后的新的坐标设为(x0, y0),有公式:
2 x0= (x - rx0)*cos(a) - (y - ry0)*sin(a) + rx0
3 y0= (x - rx0)*sin(a) + (y - ry0)*cos(a) + ry0
- 旋转公式具体如下
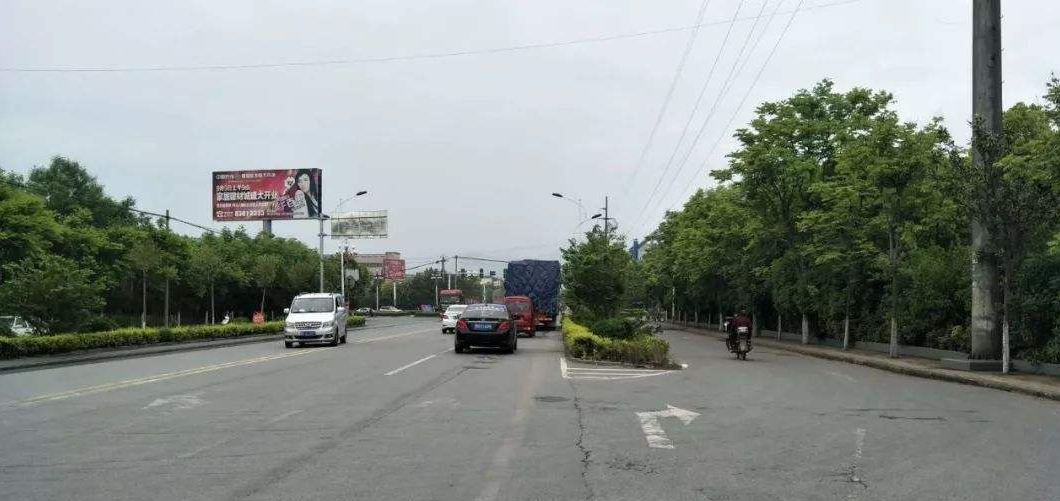
原图:
将标记框标注在图像后的结果:
- 黄色标记框为旋转角度为 0 的标记框,红色标记框为以标记框中心为旋转中心,旋转之后的标记框

具体实现代码如下:
  1 ''' 参考链接 :https://blog.csdn.net/weixin_47873308/article/details/113059744
  2 假设对图片上任意点(x,y),绕一个坐标点(rx0,ry0)逆时针旋转a角度后的新的坐标设为(x0, y0),有公式:
  3 x0= (x - rx0)*cos(a) - (y - ry0)*sin(a) + rx0
  4 y0= (x - rx0)*sin(a) + (y - ry0)*cos(a) + ry0
  5 '''
  6
  7 import math
  8 import xml.dom.minidom
  9 import matplotlib.pyplot as plt
 10 from matplotlib.image import imread
 11 import matplotlib.patches as patches
 12 from pylab import *
 13 mpl.rcParams['font.sans-serif']=['SimHei']
 14 mpl.rcParams['axes.unicode_minus']=False
 15
 16 ### 一个点以另一个点为中心旋转一定的角度
 17 def point_rotate(x, y, cx, cy, angle):
 18     x0 = (x - cx) * cos(angle) - (y - cy) * sin(angle) + cx
 19     y0 = (x - cx) * sin(angle) + (y - cy) * cos(angle) + cy
 20     return x0, y0
 21
 22 ### 绘制旋转标记框,通过四条线段组成矩形的方式进行绘制
 23 # 传入 c_x, c_y, w, h  通过绘制四条直线画出标记框
 24 def draw_bbox_by_lines(currentAxis, box, box_color):
 25     print(box)
 26     angle, cx, cy = box[0], box[1], box[2]
 27     # 计算出旋转前的各坐标
 28     x1, y1 = box[1]-box[3]/2, box[2]-box[4]/2   # 左上
 29     x2, y2 = box[1]+box[3]/2, box[2]-box[4]/2   # 右上
 30     x3, y3 = box[1]-box[3]/2, box[2]+box[4]/2   # 左下
 31     x4, y4 = box[1]+box[3]/2, box[2]+box[4]/2   # 右下
 32     # 以标记框中心为旋转中心,旋转后标记框各点的坐标
 33     x1, y1 = point_rotate(x1, y1, cx, cy, angle)
 34     x2, y2 = point_rotate(x2, y2, cx, cy, angle)
 35     x3, y3 = point_rotate(x3, y3, cx, cy, angle)
 36     x4, y4 = point_rotate(x4, y4, cx, cy, angle)
 37     # 绘制直线,通过4条直线完成标记框的绘制
 38     currentAxis.plot([x1, x2], [y1, y2], color = box_color)
 39     currentAxis.plot([x1, x3], [y1, y3], color = box_color)
 40     currentAxis.plot([x4, x2], [y4, y2], color = box_color)
 41     currentAxis.plot([x4, x3], [y4, y3], color = box_color)
 42
 43 # 定义画矩形框的函数
 44 def draw_rectangle(currentAxis, bbox, edgecolor='y', facecolor='r', fill=False, linestyle='-'):
 45     # 坐标格式为 xmin ymin w h 。 可以不是 int 类型
 46     my_angle, xmin, ymin, w, h = bbox[0], bbox[1], bbox[2], bbox[3], bbox[4]
 47     print('****************', my_angle, '********************') # my_angle/math.pi*180
 48     rect = patches.Rectangle( (xmin, ymin), w, h, angle=my_angle, linewidth=1, edgecolor=edgecolor, facecolor=facecolor, fill=fill, linestyle=linestyle)
 49     currentAxis.add_patch(rect)
 50
 51 ###  返回 xml文件中的标签名,和标记框数据
 52 # 输入:xml 路径
 53 # 返回值:一个列表,
 54 #           列表中每个元素为一个标记框的信息:标签名称, [旋转角度 坐标值]
 55 def get_bbox(xml_path):
 56     # print('xml 文件名称\t ', xml_path)
 57     box_list = []
 58     # 打开 xml文档
 59     DOMTree = xml.dom.minidom.parse(xml_path)
 60     # 得到文档元素对象
 61     collection = DOMTree.documentElement
 62     ### 文件夹名称
 63     folder_name = collection.getElementsByTagName("folder")[0].childNodes[0].data
 64     # print('文件夹名称\t', folder_name)
 65     # 文件名
 66     filenamelist = collection.getElementsByTagName("filename")[0].childNodes[0].data
 67     # print('文件名\t\t', filenamelist)
 68     # 文件路径
 69     file_path = collection.getElementsByTagName("path")[0].childNodes[0].data
 70     # print('文件路径\t\t', file_path)
 71     # 图像 size
 72     file_size = collection.getElementsByTagName("size")
 73     file_width = file_size[0].getElementsByTagName('width')[0].childNodes[0].data
 74     file_height = file_size[0].getElementsByTagName('height')[0].childNodes[0].data
 75     file_depth = file_size[0].getElementsByTagName('depth')[0].childNodes[0].data
 76     # print('图片尺寸\t\t宽 {}, 高 {}, 通道数 {}'.format(file_width, file_height, file_depth))
 77     ### 标记框信息
 78     objectlist = collection.getElementsByTagName("object")
 79     for objects in objectlist:
 80         # print('==============标记框信息==============')
 81         # 标记框类型
 82         box_type = objects.getElementsByTagName('type')[0].childNodes[0].data
 83         # print('标记框类型 \t', box_type)
 84         # 标签名称
 85         box_name = objects.getElementsByTagName('name')[0].childNodes[0].data
 86         # print('标记框类别名\t', box_name)
 87         ### 旋转标记框 , 最终结果统一为:xmin  ymin  w  h  angle
 88         if box_type == 'robndbox':
 89             bndbox = objects.getElementsByTagName('robndbox')
 90             for box in bndbox:
 91                 c_x = float(box.getElementsByTagName('cx')[0].childNodes[0].data)
 92                 c_y = float(box.getElementsByTagName('cy')[0].childNodes[0].data)
 93                 w = float(box.getElementsByTagName('w')[0].childNodes[0].data)
 94                 h = float(box.getElementsByTagName('h')[0].childNodes[0].data)
 95                 angle = float(box.getElementsByTagName('angle')[0].childNodes[0].data)
 96                 # bbox = [angle, c_x-w/2, c_y-h/2, w, h]
 97                 bbox = [angle, c_x, c_y, w, h]
 98                 # print('旋转标记框,角度+坐标值:', bbox)
 99         ### 普通标记框
100         elif box_type == 'bndbox':
101             bndbox = objects.getElementsByTagName('bndbox')
102             for box in bndbox:
103                 xmin = int(box.getElementsByTagName('xmin')[0].childNodes[0].data)
104                 ymin = int(box.getElementsByTagName('ymin')[0].childNodes[0].data)
105                 xmax = int(box.getElementsByTagName('xmax')[0].childNodes[0].data)
106                 ymax = int(box.getElementsByTagName('ymax')[0].childNodes[0].data)
107                 bbox = [0.0, xmin, ymin, xmax-xmin, ymax-ymin]
108                 # print('普通标记框,参数: ', bbox)
109         # 标记框类型(bndbox、robndbox),标记框名称,标记框信息
110         box_list.append([box_name, bbox])
111     return box_list
112
113
114 # 自定义函数,输入图像和 gtbox
115 def draw_bbox(img_path, bboxes, img_save_path):
116     img = imread(img_path)
117     plt.figure(num=1)       # 使用同一张画布,最终只会展示最后一张图片
118     plt.axis('off')
119     plt.imshow(img)
120     currentAxis = plt.gca()
121     # 绘制矩形框, 挨个画,最终在图片上一起展示
122     for box in bboxes:
123         box_name = box[0]   # 标记框名称
124         bbox = box[1]       # 标记框信息
125         ### 旋转角度为 0 的标记框使用  patches.Rectangle 的方式进行绘制
126         if bbox[0] == 0:
127             draw_rectangle(currentAxis, bbox, edgecolor='y')
128             plt.scatter(bbox[1]+bbox[3]/2, bbox[2]+bbox[4]/2, s=30, c='r', alpha=1) # 绘制中心点坐标
129         # 旋转角度不为 0 ,通过直线组成标记框的方式进行绘制
130         else:
131             draw_bbox_by_lines(currentAxis, bbox, 'r')
132             plt.scatter(bbox[1], bbox[2], s=30, c='r', alpha=1)                     # 绘制中心点坐标
133             ### 绘制没有旋转的标记框
134             bbox2 = [bbox[0], bbox[1]-bbox[3]/2, bbox[2]-bbox[4]/2, bbox[3], bbox[4]]
135             draw_rectangle(currentAxis, bbox2, edgecolor='y')
136
137
138
139
140             print()
141         ### 标记框对应的标签
142         plt.text(bbox[1]+3, bbox[2]+13, box_name, fontsize=8, color='yellow')
143
144     plt.savefig(img_save_path, bbox_inches='tight', pad_inches=0, dpi=500)
145     plt.show()
146     plt.close()
147
148
149 image_path = '../data/2.jpg'
150 xml_path = '../data/2.xml'
151 img_save_path = '../data/22_labeled.jpg'
152
153 bboxes = get_bbox(xml_path)
154 # print(bboxes)
155 draw_bbox(image_path, bboxes, img_save_path)
