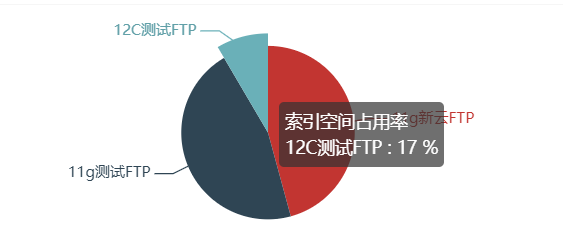
效果图

 1     /**
 2      * 显示服务器索等信息
 3      *
 4      * @param request
 5      * @param resp
 6      * @throws IOException
 7      */
 8     @RequestMapping(value = "indexSpace")
 9     public void indexSpace(HttpServletRequest request, HttpServletResponse resp) throws IOException {
10         resp.setContentType("text/plain; charset=UTF-8");
11         resp.setCharacterEncoding("UTF-8");
12         Map<String, String> map = new HashMap<>();
13         map = iConnectServerService.indexSpace();
14         PrintWriter out = resp.getWriter();
15         out.print(JSONObject.toJSONString(map)); //将map转为json
16         out.flush();//清空输出流
17         System.out.println(JSONObject.toJSONString(map));
18     }
 1     /**
 2      * 检查索引空间剩余量
 3      *
 4      * @return
 5      */
 6     @Override
 7     public Map<String, String> indexSpace() {
 8         String test1 = server("df -hi /home", "ip", "账号", "密码");
 9         String test2 = server("df -hi /home", "ip", "账号", "密码");
10         String test3 = server("df -hi /home", "ip", "账号", "密码");
11
12         test1 = checkNode(test1); //获取具体数字
13         test2 = checkNode(test2);//获取具体数字
14         test3 = checkNode(test3);//获取具体数字
15
16         Map<String, String> map = new HashMap<>();
17         map.put("test1", test1);
18         map.put("test2", test2);
19         map.put("test3", test3);
20
21         return map;
22     }
 1 /**
 2      * 字符串截取
 3      *
 4      * @param result
 5      * @return
 6      */
 7     public String checkNode(String result) {
 8         String xj = result.replaceAll(".*[^\\d](?=(\\d+))", "");
 9         String regEx = "[^0-9]";
10         Pattern p = Pattern.compile(regEx);
11         Matcher m = p.matcher(xj);
12         String yj = m.replaceAll("").trim();
13         System.out.println(yj);
14         return yj;
15     }
前端echarts
 1         $.ajax({
 2                 method: 'get',
 3                 url: "${pageContext.request.contextPath}/server/indexSpace",
 4                 success: function (res) {
 5                     const resp = JSON.parse(res);
 6                     const test1 = resp["test1"];
 7                     const test2 = resp["test2"];
 8                     const test3 = resp["test3"];
 9
10                     //图示:圆形
11                     // 基于准备好的dom,初始化echarts实例
12                    var myChart = echarts.init(document.getElementById('InterfaceAdjustment_sector'), 'echarts-plus');
13
14                     myChart.setOption({
15
16                         title : {
17                             text: '',
18                             x:'left',
19                             textStyle:{
20                                 color:'#FFFFFF',
21                                 fontSize:20
22                             }
23                         },
24                         tooltip : {
25                             trigger: 'item',
26                             formatter: "{a} <br/>{b} : {c} %"
27                         },
28                         legend: {
29                             orient : 'vertical',
30                             x : 'left',
31                             top:40,
32                             itemWidth:70,
33                             itemHeight:30,
34                             formatter: '{name}',
35                             textStyle:{
36                                 color: '#FFFFFF'
37                             },
38                             data:[{name:'test1',icon:'rect'},
39                                 {name:'test2',icon:'rect'},
40                                 {name:'test3',icon:'rect'}
41                             ]
42                         },
43                         calculable: true,
44                         series: [
45                             {
46                                 name: '索引空间',
47                                 type: 'pie',    // 设置图表类型为饼图
48                                 radius: '75%',  // 饼图的半径,外半径为可视区尺寸(容器高宽中较小一项)的 55% 长度。
49
50                                 data: [ // 数据数组,name 为数据项名称,value 为数据项值
51                                     {value: test1, name: '11g新云FTP'},
52                                     {value: test2, name: '11g测试FTP'},
53                                     {value: test3, name: '12C测试FTP'}
54                                 ]
55                             }
56                         ]
57                     })
58                 }
59             })