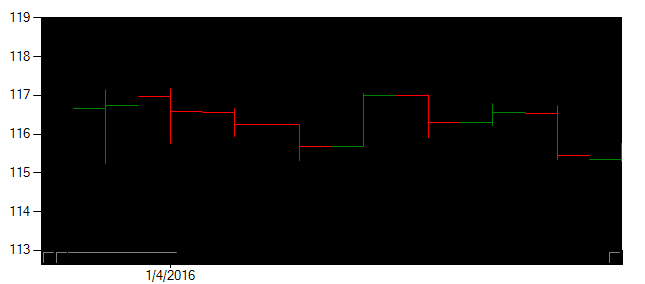
Use chart to show stock chart

void createchart()
{
    // Create a chart and specify its location.
    chart1.Series.Clear();
    chart1.ChartAreas.Clear();
    chart1.ChartAreas.Add("ChartArea1");
    chart1.Series.Add("Daily");
    chart1.Series[0].ChartType = SeriesChartType.Stock;
    chart1.ChartAreas["ChartArea1"].BackColor = System.Drawing.Color.Black;

    chart1.ChartAreas["ChartArea1"].AxisX.MajorGrid.LineWidth = 0;
    chart1.ChartAreas["ChartArea1"].AxisY.MajorGrid.LineWidth = 0;

    //Init
    chart1.Series["Daily"].Color = Color.Blue;
    chart1.Series["Daily"].XValueMember = "Day";
    chart1.Series["Daily"].YValueMembers = "High,Low,Open,Close";
    chart1.Series["Daily"].XValueType = System.Windows.Forms.DataVisualization.Charting.ChartValueType.DateTime;
    chart1.Series["Daily"].CustomProperties = "PriceDownColor=Green, PriceUpColor=Red";
    chart1.Series["Daily"]["OpenCloseStyle"] = "Line";
    chart1.Series["Daily"]["ShowOpenClose"] = "Both";
    chart1.DataManipulator.IsStartFromFirst = true;
    chart1.ChartAreas[0].AxisX.ScrollBar.Enabled = true;
    chart1.ChartAreas[0].AxisX.IsLabelAutoFit = true;
    chart1.ChartAreas[0].AxisX.ScaleView.Size = 8;

    chart1.ChartAreas[0].AxisX.LabelStyle.Format = "yyyy-MM-dd";
    chart1.ChartAreas[0].AxisX.Interval = 1;
    chart1.ChartAreas[0].AxisX.IntervalType = DateTimeIntervalType.Months;
    chart1.ChartAreas[0].AxisX.IntervalOffset = 1;

    //Read in symbolfile
    List<String> dataLIST = new List<String>();
    //readinfile("C:/GlobeTrading/MarketData/NYSE/Stocks/Intradata/30 min/sivb.txt", ReadNormalToLower.Normal, out dataLIST);
    dataLIST.Add("01/04/2016,0930,116.67,117.14,115.23,116.73,18200");
    dataLIST.Add("01/04/2016,1000,116.98,117.17,115.75,116.59,16200");
    dataLIST.Add("01/04/2016,1030,116.56,116.65,115.94,116.24,10600");
    dataLIST.Add("01/04/2016,1100,116.24,116.24,115.31,115.67,6300");
    dataLIST.Add("01/04/2016,1130,115.67,117.06,115.67,117,2700");
    dataLIST.Add("01/04/2016,1200,117,117.02,115.92,116.31,7200");
    dataLIST.Add("01/04/2016,1230,116.31,116.79,116.22,116.56,6100");
    dataLIST.Add("01/04/2016,1300,116.52,116.74,115.35,115.44,18700");
    dataLIST.Add("01/04/2016,1330,115.34,115.75,115.3,115.75,6600");
    dataLIST.Add("01/04/2016,1400,115.75,115.97,115.44,115.87,5000");
    dataLIST.Add("01/04/2016,1430,115.87,115.87,115.4,115.66,9800");
    dataLIST.Add("01/04/2016,1500,115.61,115.66,115.27,115.46,12800");
    dataLIST.Add("01/04/2016,1530,115.46,116.57,115.39,116.57,29200");
    dataLIST.Add("01/05/2016,0930,116.39,118.01,116.39,116.99,10100");
    dataLIST.Add("01/05/2016,1000,117.09,117.48,116.44,116.5,3400");
    dataLIST.Add("01/05/2016,1030,116.5,117.16,116.46,117.08,2900");
    dataLIST.Add("01/05/2016,1100,117.08,117.08,115.99,116.17,3700");
    dataLIST.Add("01/05/2016,1130,116.17,116.66,116.17,116.37,2100");
    dataLIST.Add("01/05/2016,1200,116.3,116.35,115.68,115.91,3800");
    dataLIST.Add("01/05/2016,1230,115.91,116.55,115.77,116.49,7600");
    dataLIST.Add("01/05/2016,1300,116.52,116.73,115.9,116.07,3500");
    dataLIST.Add("01/05/2016,1330,116.07,117.06,116.03,116.68,4000");
    dataLIST.Add("01/05/2016,1400,116.49,116.53,115.9,115.98,4300");
    dataLIST.Add("01/05/2016,1430,115.99,116.26,115.98,116.13,3600");
    dataLIST.Add("01/05/2016,1500,116.25,116.55,115.86,116.38,5300");
    dataLIST.Add("01/05/2016,1530,116.35,116.7,116.07,116.57,21900");
    dataLIST.Add("01/06/2016,0930,114.43,116.21,114.16,116.11,12700");
    dataLIST.Add("01/06/2016,1000,116.11,116.46,114.87,115.47,9100");
    dataLIST.Add("01/06/2016,1030,115.42,115.71,115.07,115.71,5900");
    dataLIST.Add("01/06/2016,1100,115.71,116.38,115.35,115.98,4200");
    dataLIST.Add("01/06/2016,1130,116.06,116.19,115.81,115.83,3300");
    dataLIST.Add("01/06/2016,1200,115.53,115.9,115.1,115.21,8200");
    dataLIST.Add("01/06/2016,1230,115.1,115.26,114.75,114.79,9200");
    dataLIST.Add("01/06/2016,1300,114.75,115.15,114.49,115.01,5200");
    dataLIST.Add("01/06/2016,1330,115.1,115.2,114.64,114.65,4400");
    dataLIST.Add("01/06/2016,1400,114.59,114.9,114.41,114.82,6300");
    dataLIST.Add("01/06/2016,1430,114.82,114.9,113.95,114.04,4300");
    dataLIST.Add("01/06/2016,1500,114.11,114.75,113.87,114.69,4700");
    dataLIST.Add("01/06/2016,1530,114.69,114.75,114.3,114.62,14400");


    List<String> allparams = new List<String>();
    List<String> allparams2 = new List<String>();
    for (int i = 0; i < dataLIST.Count; i++)
    {
        //01/04/2016,0930,2.34,2.34,2.34,2.34,100
        allparams = new List<String>(dataLIST[i].Split(','));
        if (allparams.Count == 7)
        {
            allparams2 = new List<String>(allparams[0].Split('/'));
            if (allparams2.Count == 3)
            {
                DateTime date = new DateTime(Convert.ToInt32(allparams2[2]), Convert.ToInt32(allparams2[0]), Convert.ToInt32(allparams2[1]), Convert.ToInt32(allparams[1].Substring(0, 2)), Convert.ToInt32(allparams[1].Substring(2)), 1);
                double thedate = date.ToOADate();
                //string thedate = date.ToShortDateString();

                double open = Convert.ToDouble(allparams[2]);
                double high = Convert.ToDouble(allparams[3]);
                double low = Convert.ToDouble(allparams[4]);
                double close = Convert.ToDouble(allparams[5]);

                //"High,Low,Open,Close"
                chart1.Series[0].Points.AddXY(thedate, high, low, open, close);
                chart1.Series[0]["PointWidth"] = "1";

                if (open < close)
                {
                    chart1.Series[0].Points[i].Color = Color.Green;
                }
                if (open > close)
                {
                    chart1.Series[0].Points[i].Color = Color.Red;
                }
            }
        }
    }
    chart1.ChartAreas[0].AxisX.IsStartedFromZero = false;
    chart1.ChartAreas[0].AxisY.IsStartedFromZero = false;
}
The result:

The date on the X-axis is continuous, however, the value of the corresponding Y-axis is empty.
In order to eliminate the gap between data, you can modify
double thedate = date.ToOADate();
with
string thedate = date.ToShortDateString();
However, the result will look like this,

This issue has not been resolved perfectly yet.
