• highcharts插件


    详见官网:https://www.highcharts.com.cn/demo/highcharts

    详细使用代码:

    <!DOCTYPE html>
    <html lang="en">
    <head>
        <meta charset="UTF-8">
        <title>Title</title>
        <link rel="stylesheet" href="https://cdn.bootcss.com/bootstrap/3.3.7/css/bootstrap.css">
        <script src="https://cdn.bootcss.com/jquery/3.3.1/jquery.js"></script>
        <script src="/static/Highcharts-6.1.2/code/highcharts.js"></script>
        <script src="/static/js/record_score.js"></script>
    
    </head>
    <body>
    <div class="alert alert-info alert-dismissible" role="alert" style="text-align: center" style="font-size: 26px;">
        <strong>{{ student_obj }}的信息</strong>
    </div>
    {% csrf_token %}
    <div class="container">
        <div class="row">
            <div class="col-md-8 col-md-offset-2" style="margin-top: 20px;">
                <form action="" method="post">
                {%csrf_token%}
                    <table class="table-hover table  table-striped">
                        <thead>
                        <tr class="warning">
                            <th>序号</th>
                            <th>班级名称</th>
                            <th>班主任</th>
                            <th>讲师</th>
                            <th>查看成绩</th>
                        </tr>
                        </thead>
                        <tbody>
                        {% for cls in class_list %}
                            <tr class="success">
                                <td>{{ forloop.counter }}</td>
                                <td>{{ cls }}</td>
                                <td>{{ cls.tutor }}</td>
                                <td>
                                    {% for t in cls.teachers.all %}
                                    {{t}}
                                    {% endfor %}
                                </td>
                                <td><a sid="{{student_obj.pk}}" cid="{{cls.pk}}" href="javascript:void(0)" class="score_chart" >查看柱状图</a>
                                </td>
                            </tr>
                        {% endfor %}
    
                        </tbody>
                    </table>
                </form>
            </div>
        </div>
    </div>
    
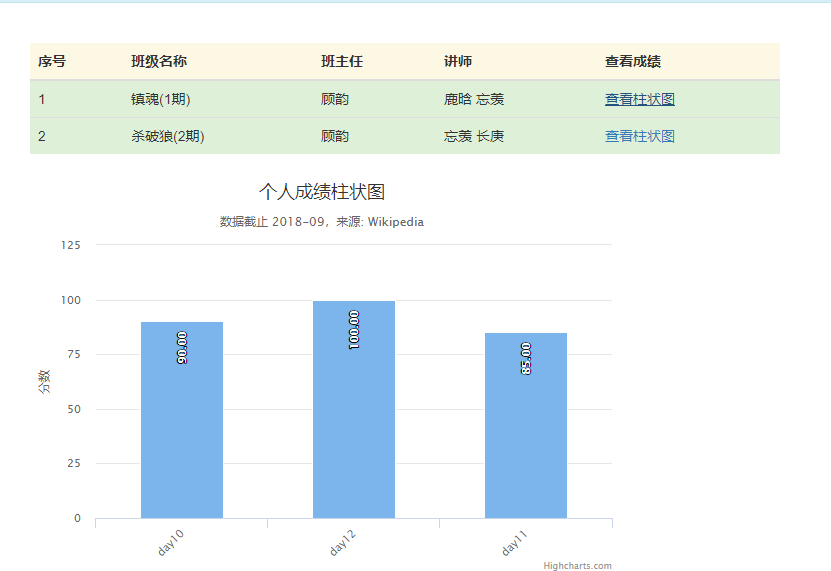
    <div id="score_chart" style="600px;height:400px;margin-left: 300px;"></div>
    
    <script>
    
        $(".score_chart").click(function () {
    
                   var cid=$(this).attr("cid");
                   $.ajax({
                       url:"",
                       type:"get",
                       data:{
                           cid:cid
                       },
                       success:function (data) {
                               var chart = Highcharts.chart('score_chart', {
                        chart: {
                            type: 'column'
                        },
                        title: {
                            text: '个人成绩柱状图'
                        },
                        subtitle: {
                            text: '数据截止 2018-09,来源: <a href="https://en.wikipedia.org/wiki/List_of_cities_proper_by_population">Wikipedia</a>'
                        },
                        xAxis: {
                            type: 'category',
                            labels: {
                                rotation: -45 // 设置轴标签旋转角度
                            }
                        },
                        yAxis: {
                            min: 0,
                            title: {
                                text: '分数'
                            }
                        },
                        legend: {
                            enabled: false
                        },
                        tooltip: {
                            pointFormat: '当天分数: <b>{point.y:.2f} 分</b>'
                        },
                        series: [{
                            name: '总人口',
                            data: data,
                            dataLabels: {
                                enabled: true,
                                rotation: -90,
                                color: '#FFFFFF',
                                align: 'right',
                                format: '{point.y:.2f}', // :.1f 为保留 1 位小数
                                y: 10
                            }
                        }]
                    });
                       }
                   });


        })


    </script>
    
    </body>
    </html>
  • 相关阅读:
    力扣 503 :下一个更大元素 II
    力扣 684 :冗余连接
    时间空间复杂度
    并查集
    UE4解决贴花拉伸的简单办法
    《程序员修炼之道Ⅱ》读书简记
    mac中安装支持m1的软件,提示已损坏问题解决
    在idea中构建gradle项目报错Command line is too long
    向上向下取整
    web端开发工具下载地址
  • 原文地址:https://www.cnblogs.com/hnlmy/p/10713151.html
Copyright © 2020-2023  润新知