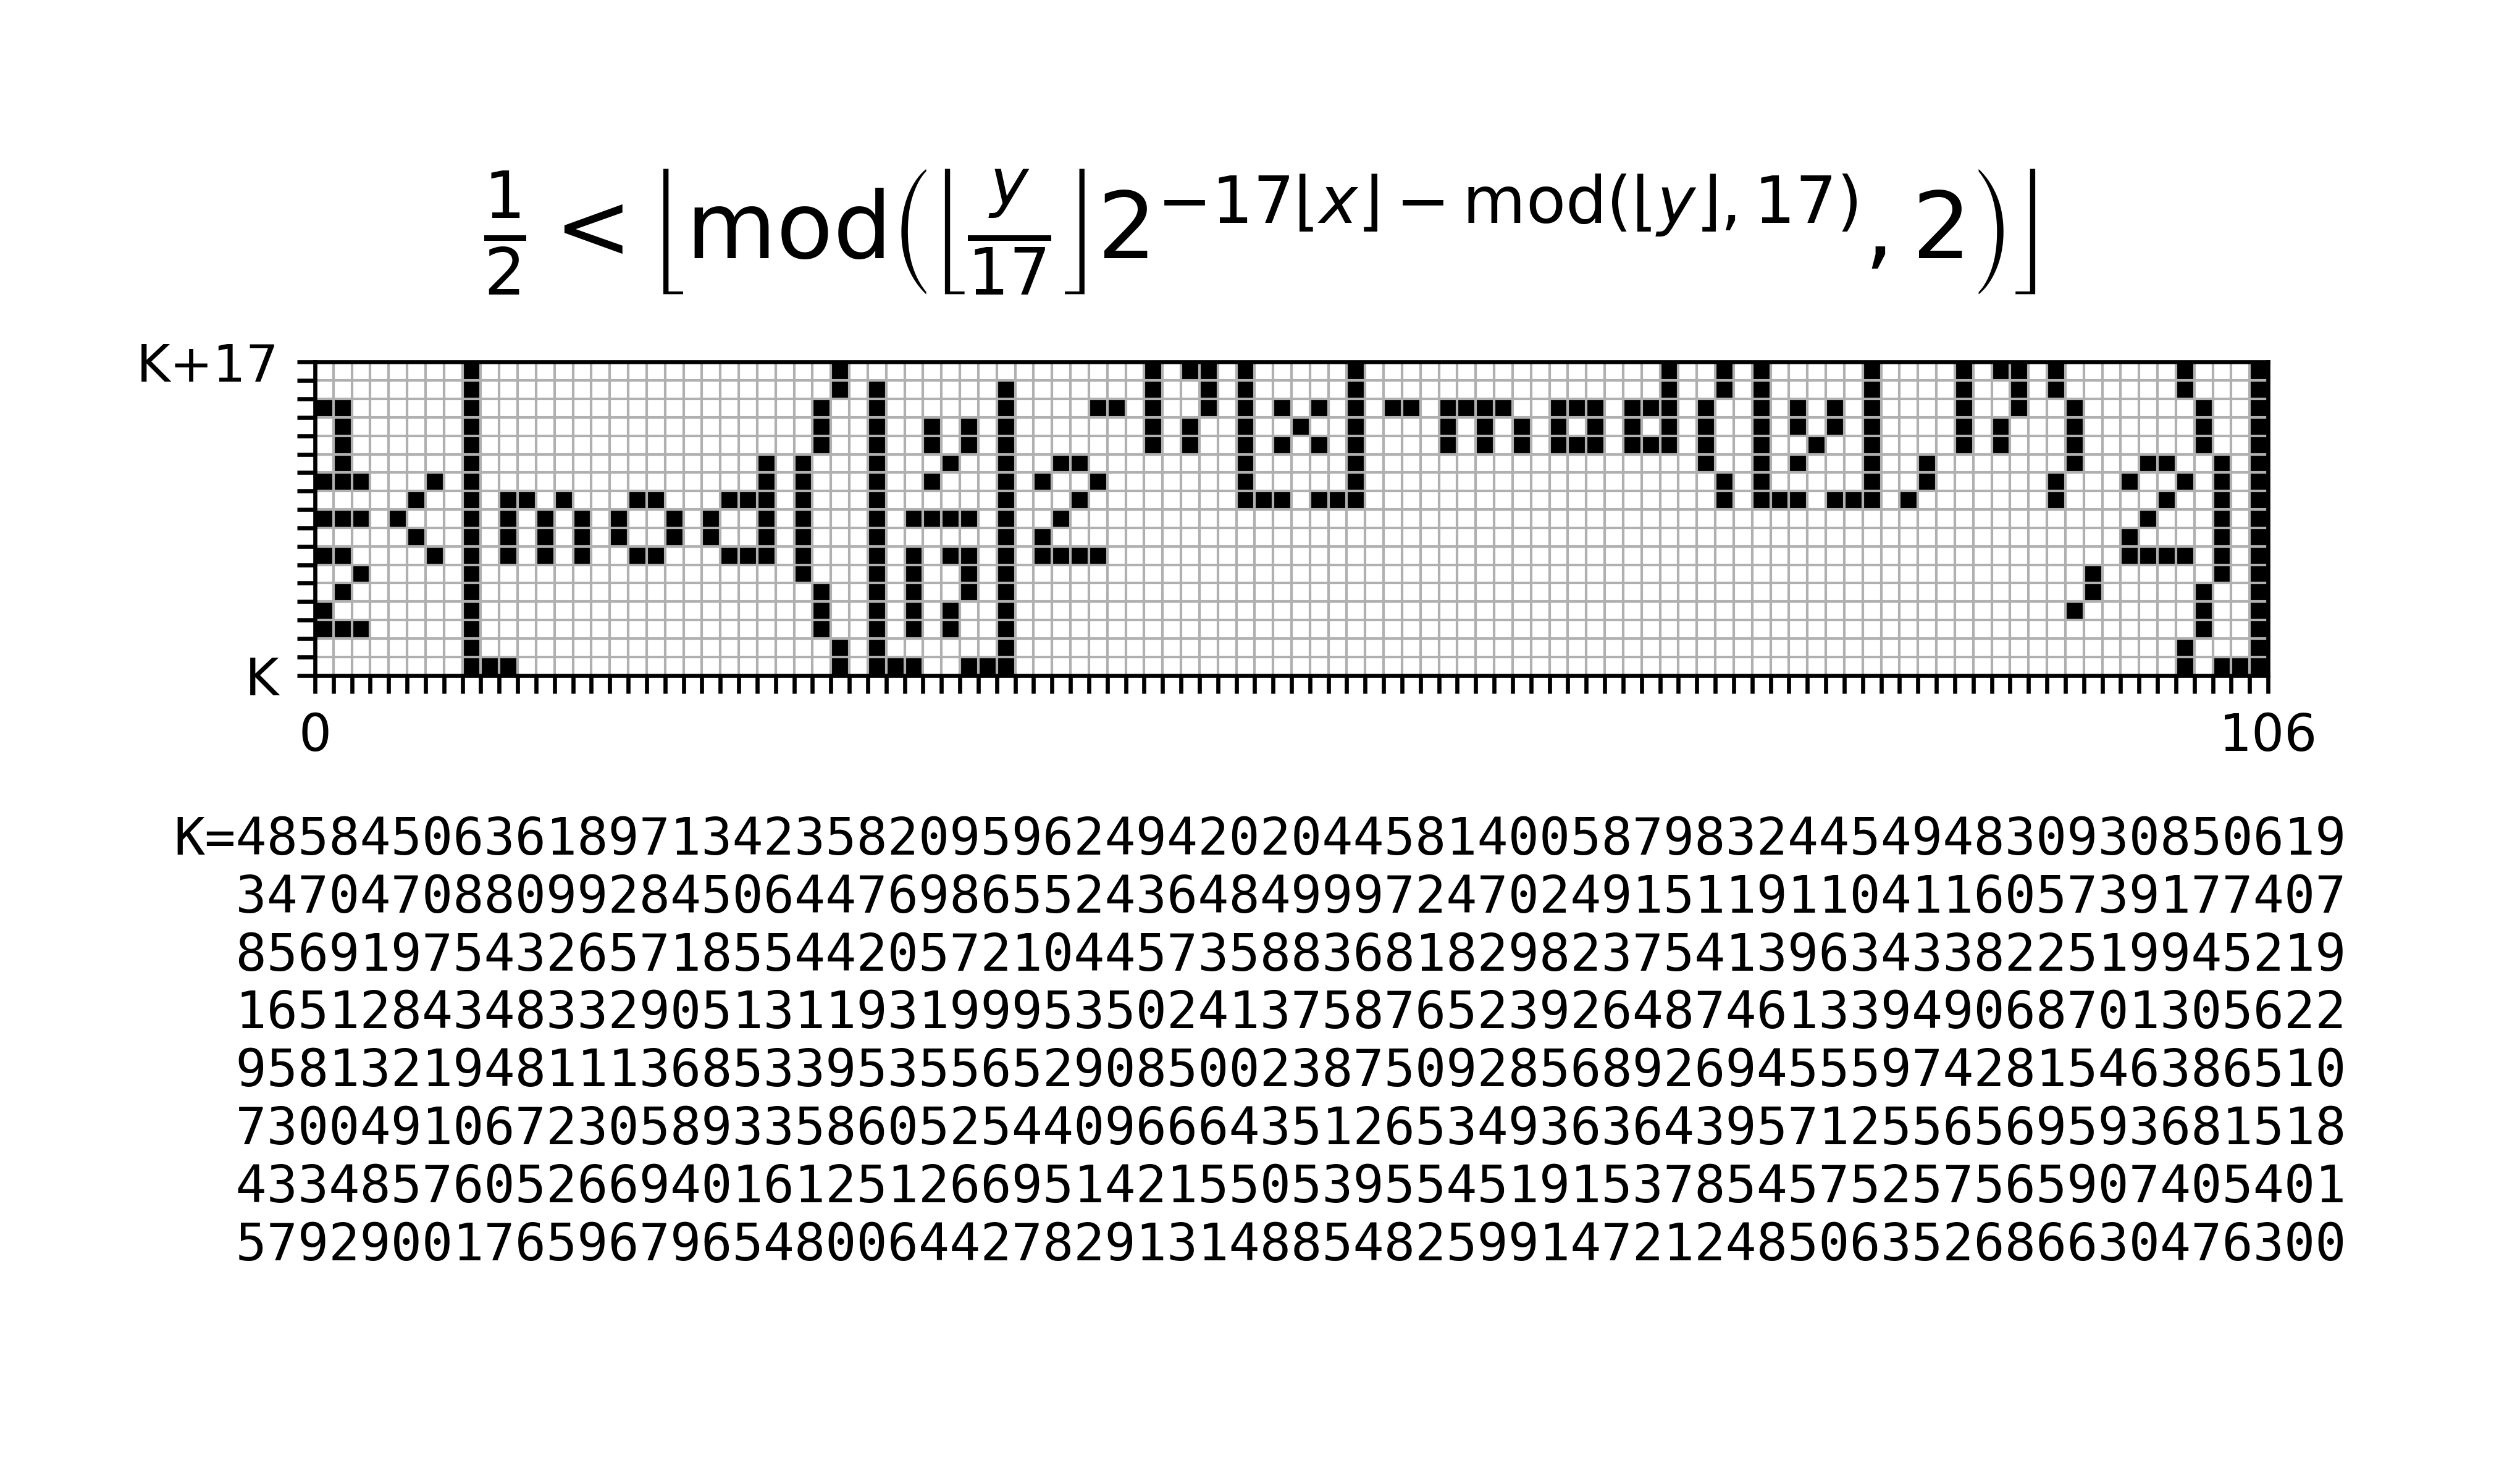
"""
Plot Tupper's self-referential formula
"""
import textwrap
import matplotlib.pyplot as plt

K = 4858450636189713423582095962494202044581400587983244549483093085061934704708809928450644769865524364849997247024915119110411605739177407856919754326571855442057210445735883681829823754139634338225199452191651284348332905131193199953502413758765239264874613394906870130562295813219481113685339535565290850023875092856892694555974281546386510730049106723058933586052544096664351265349363643957125565695936815184334857605266940161251266951421550539554519153785457525756590740540157929001765967965480064427829131488548259914721248506352686630476300

H = 17
W = 106

if __name__ == "__main__":
    plt.figure(figsize=(6.8, 4), dpi=600)
    plt.axis("scaled")

    K_ = K//17
    for x in range(W):
        for y in range(H):
            if K_ & 1:
                plt.bar(x+0.5, bottom=y, height=1,
                        width=1, linewidth=0, color="black")
            K_ >>= 1

    plt.figtext(0.5, 0.8, r"$frac{1}{2}<leftlfloor operatorname{mod}left(leftlfloorfrac{y}{%d}
ight
floor 2^{-%dlfloor x
floor-operatorname{mod}(lfloor y
floor, %d)}, 2
ight)
ight
floor$" % (H, H, H), ha="center", va="bottom", fontsize=18)
    plt.subplots_adjust(top=0.8, bottom=0.5)
    K_str = textwrap.wrap(str(K), 68)
    K_str[0] = f"K={K_str[0]}"
    for i in range(1, len(K_str)):
        K_str[i] = f"  {K_str[i]}".ljust(70)
    K_str = "
".join(K_str)
    plt.figtext(0.5, 0.45, K_str, fontfamily="monospace", ha="center", va="top")

    plt.xlim((0, W))
    plt.ylim((0, H))
    xticks = list(range(0, W+1))
    xlabels = ["" for i in xticks]
    xlabels[0] = "0"
    xlabels[-1] = str(W)
    plt.xticks(xticks, xlabels)
    yticks = list(range(0, H+1))
    ylabels = ["" for i in yticks]
    ylabels[0] = "K"
    ylabels[-1] = f"K+{H}"
    plt.yticks(yticks, ylabels)
    plt.grid(b=True, linewidth=0.5)

    # plt.show()
    plt.savefig("Tupper-plot.png")
    # plt.savefig(fname="name", format="svg")

这里提供一个我制作的美丽的 K:
7732976080303657178450278534515545953721691814147533396385378515089514321412513402545421375117579981371482452840580788702200589467998016752192433975084223850171463216577990190222625558829816705774713175142624997893397311119169088047377804572616598140125557066157243777474327577549172021746170650767594397179529901385386121610472318392330362185272131140291220890569772667378408360058487300270037068960274089417160464881353145903925802568200831976051484240342927128191427075003633328171454983396758112849394920257608196936104830566400